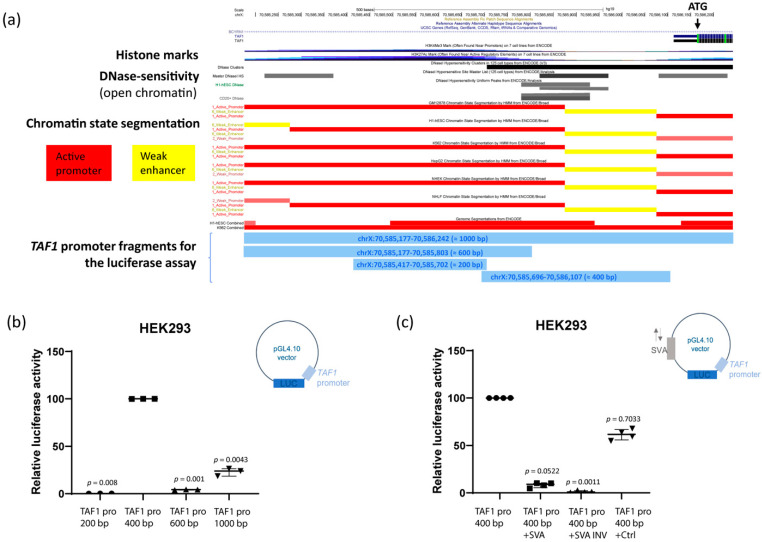
Figure 4.
Regulatory potential of the SVA in vitro. (a) UCSC browser screenshot of the TAF1 promoter region, showing DNase sensitivity, histone modifications and chromatin state segmentation in various cell types. In light blue (the lower part of the figure) are shown promoter fragments that were investigated in luciferase reporter assays, along with their genomic coordinates (hg19). Note that the most active TAF1 promoter region (fragment ≈ 400 bp) overlaps with the DNase-sensitive region, characteristic of open chromatin. (b) Relative luciferase activity (Firefly counts/Renilla TK counts) of different TAF1 promoter regions define the most active region (Fragment ≈ 400 bp). (c) Relative luciferase activity of the XDP-specific SVA-inserted sense or antisense (INV-inverted), as compared to a size-matched control. Maximum activity (100%) was exerted by the vector containing only the most active promoter region (TAF1 pro 400 bp), and p values are calculated relative to this sample using Kruskal–Wallis and Dunn’s multiple comparison tests.

