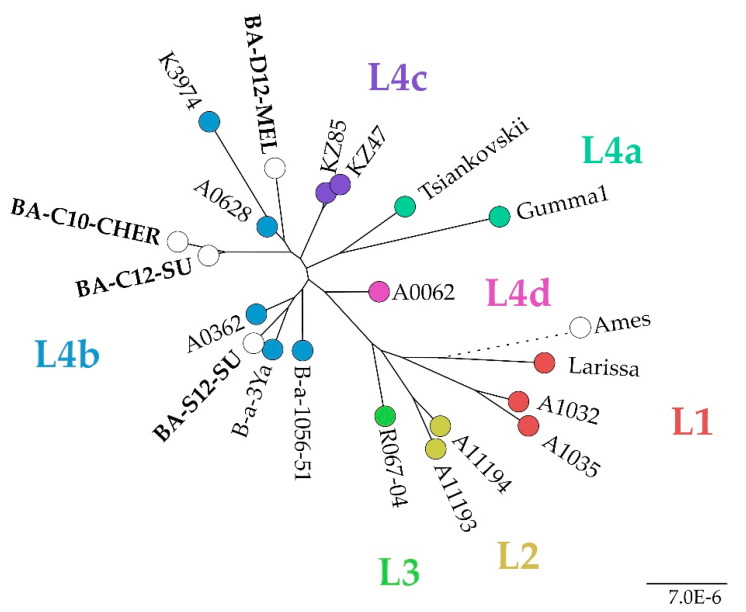
Figure 4.
Maximum Likelihood tree based on SNP typing of strains of the Tsiankovskii clade, generated with snippy. Colours indicate affiliation to sublineages within the group, according to Shevtsov et al. [39]. The scale bar indicates the number of nucleotide changes per site.

