Figure 6.
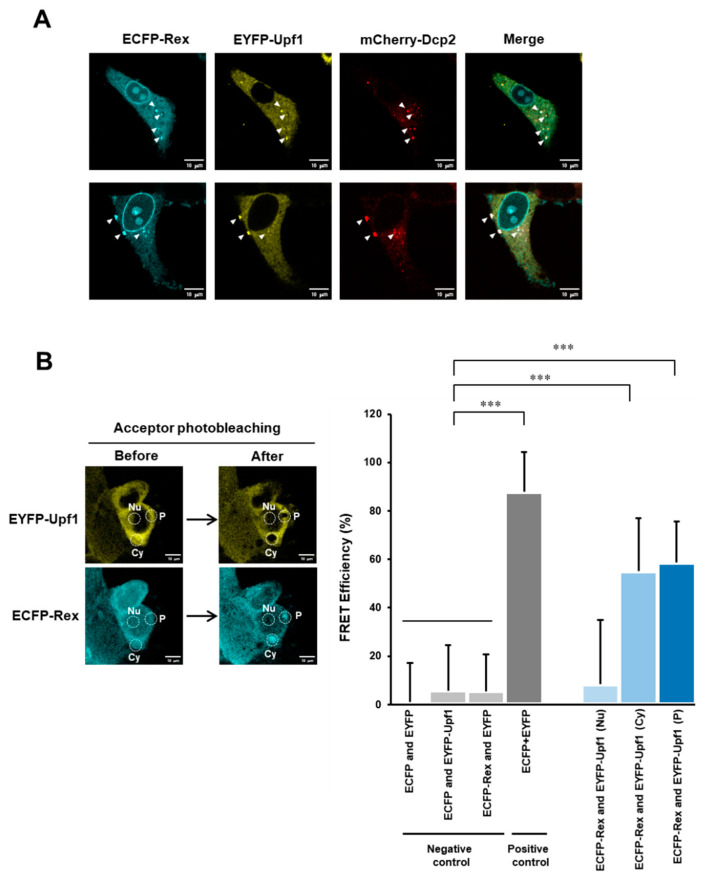
Rex interacts with Upf1 in the cytoplasm and in the p-body. (A). Confocal laser microscopy images of ECFP-Rex, EYFP-Upf1, and mCherry-Dcp2 in HeLa cells, where Dcp2 is a p-body marker. The white arrowhead indicates the site of the p-body. The scale bar indicates 10 μm. (B). The strength of the interaction between Rex and Upf1 in the cytoplasm, the p-body and the nucleus was analyzed by FRET. The left panel shows an example of images before and after acceptor photobleaching by confocal laser microscopy in HEK293FT cells co-expressing ECFP-Rex and EYFP-Upf1. The dotted white circles indicate regions where photobleaching was applied (Cy = cytoplasm, P = p-body, and Nu = nucleus, The scale bar indicates 10 μm.). The graph on the right shows the FRET efficiency (%). Significantly higher FRET efficiency was detected in the positive control (tandem ECFP + EYFP) than in the negative controls (ECFP and EYFP, ECFP and EYFP-Upf1, ECFP-Rex and EYFP), demonstrating that FRET efficiency is correctly measured in this method. The FRET efficiency between ECFP-Rex and EYFP-Upf1 was significantly higher in the cytoplasm and the p-body, indicating that Rex and Upf1 interact at these intracellular sites (n = 6–10, mean ± SD, *** p < 0.001).

