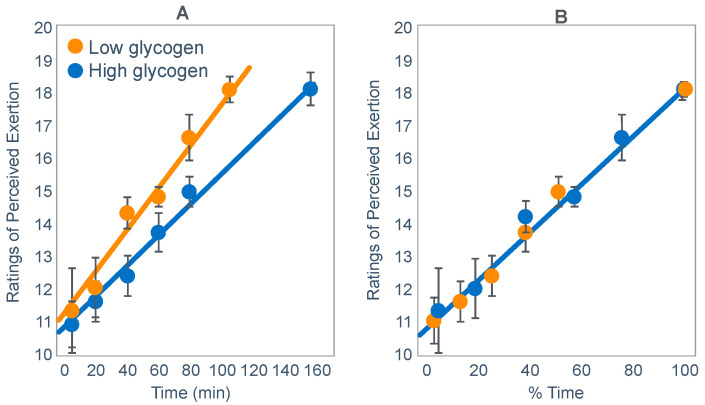
Figure 19.
Ratings of perceived exertion (RPE) rose as a linear function of absolute exercise durations in the study of Baldwin et al. [42] in subjects who began exercise with either low or high muscle glycogen content (panel A). When the same data are expressed as a function of relative (%) time, (panel B) the lines overlap. Thus, the RPE rises as a linear function of the expected duration of the exercise that is being performed. Adapted with permission from ref. [116]. Copy-right Year 2004 American Physiological Society.

