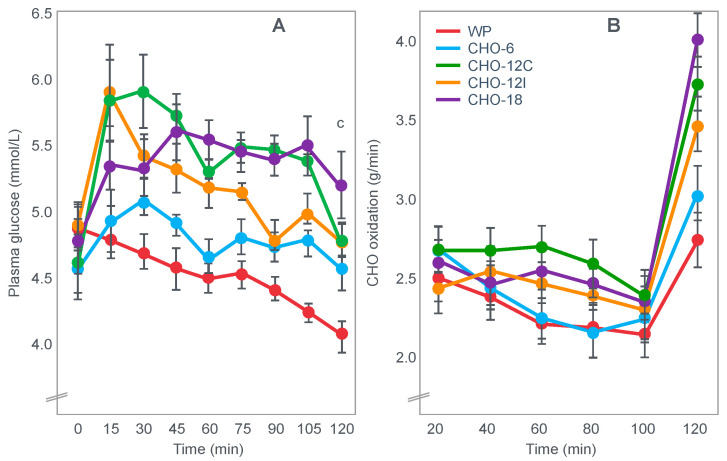
Figure 21.
Changes in plasma glucose concentrations (panel A) and in rates of carbohydrate oxidation (panel B) when subjects drank either placebo or one of four different carbohydrate solutions with different carbohydrate concentrations (6, 12 or 18%). CHO-12C and CHO-12I refer to trials that were conducted continuously (C) or intermittently (I). Adapted with permission from ref. [51]. Copy-right 1989 American Physiological Society.

