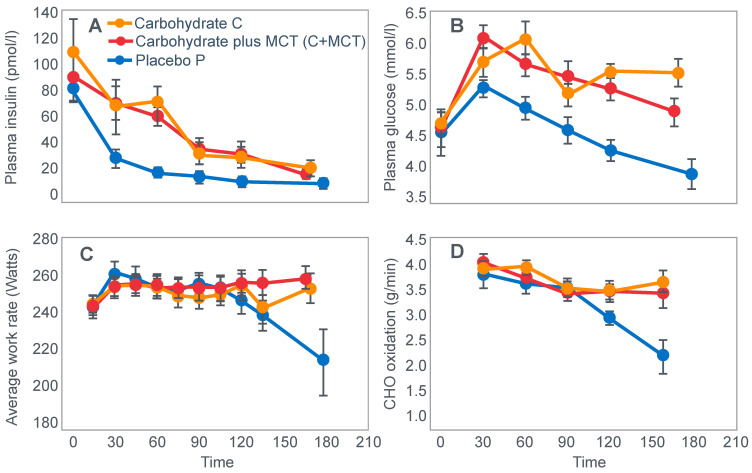
Figure 24.
Changes in plasma insulin (panel A) and plasma glucose (panel B) concentrations; average work rate (panel C) and rates of carbohydrate oxidation (panel D) when subjects ingested either carbohydrate (C), carbohydrate plus medium chain triglycerides (C + MCT) or a sweetened placebo (P) during a 100 km cycling time trial in the laboratory. Note: In the original diagrams, it is not possible in some panels to distinguish between lines drawn for the C and C + M groups as the lines appear to be incorrectly labelled. However, the lines are largely overlapping. Adapted with permission from ref. [69]. Copy-right 2000 American Physiological Society.

