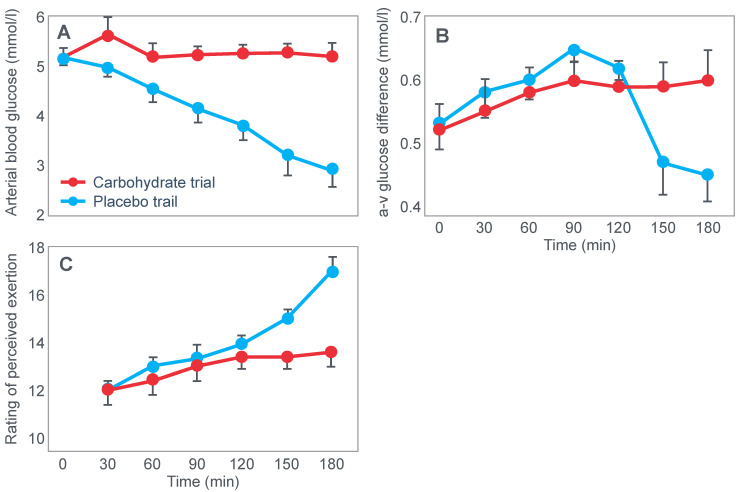
Figure 26.
Changes in arterial blood glucose (panel A) concentrations, arteriovenous glucose differences across the brain (panel B) and ratings of perceived exertion (panel C) in subjects when they ingested placebo or glucose during 180 min of exercise. Adapted with permission from ref. [123]. Copy-right 2003 Acta Physiologica (John Wiley and Sons).

