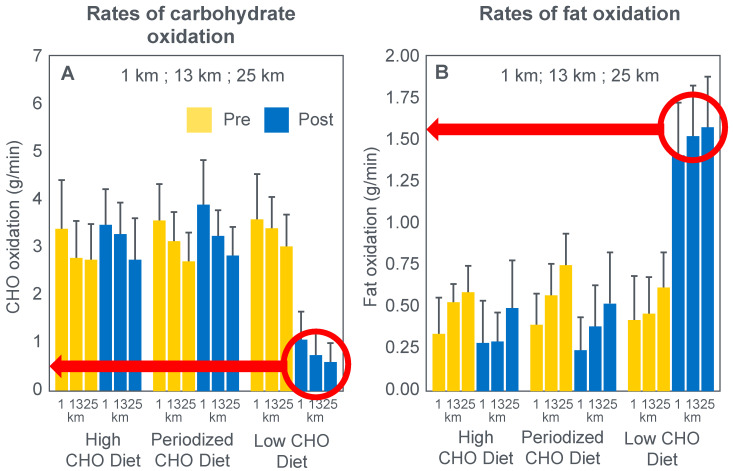
Figure 28.
Rates of carbohydrate (panel A) and fat oxidation (panel B) measured at 1, 13 and 25 km in race walkers during two 25 km time trials before and after they had adapted to one of three different dietary options—high-carbohydrate diet; a periodized carbohydrate diet; and a low-carbohydrate high-fat diet. Adapted with permission from ref. [134]. Copy-right 2017 The Physiological Society (John Wiley and Sons).

