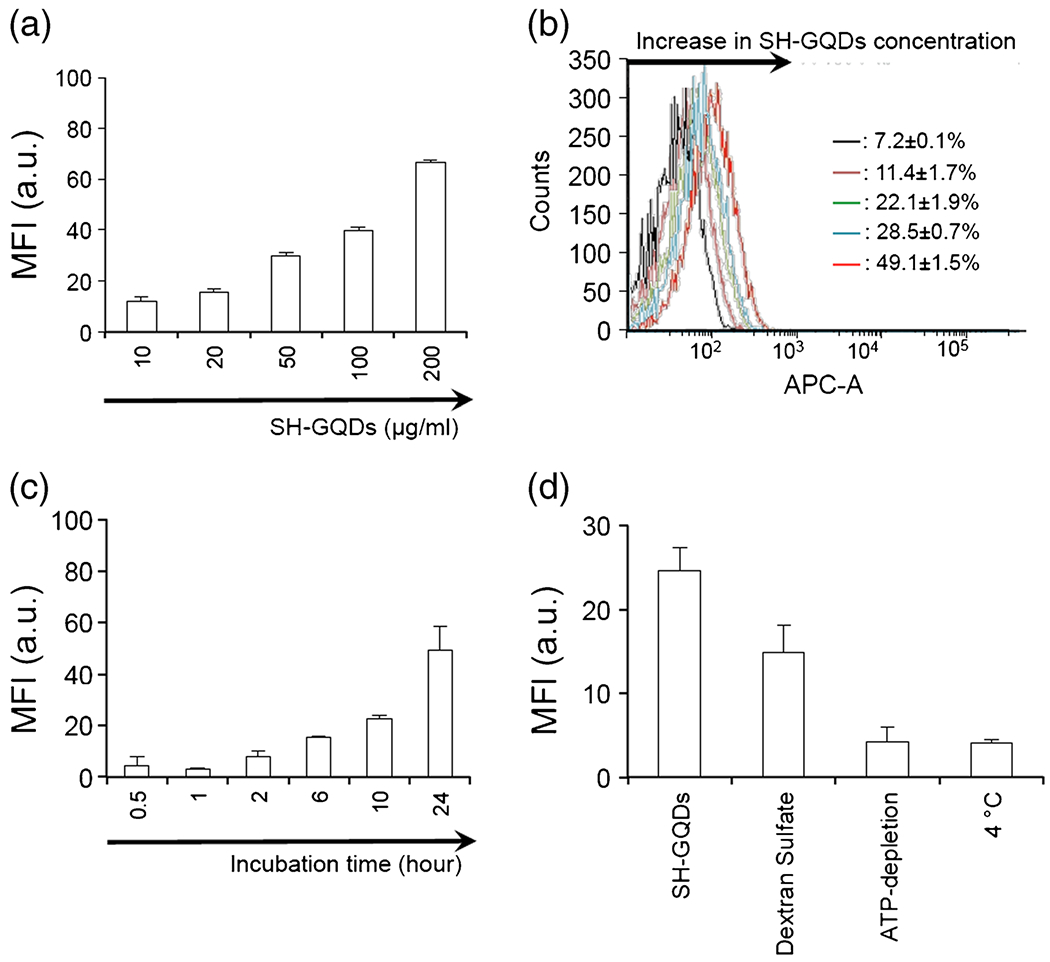
Fig. 1.

(a) Flow cytometry cellular uptake assay of SH-GQDs (n = 3). Raw264.7 cells were incubated with varying concentration of SH-GQDs (10, 20, 50, 100 and 200 μg/ml) for 24 h at 37°C. (b) Flow cytometry histogram illustrating cellular uptake of SH-GQDs. Inset: Histogram showed a peak-shifted to right as SH-GQDs concentration increased (7.2 ± 0.1% to 49.1 ± 1.5%). (c) Flow cytometry cellular uptake assay of SH-GQDs (200 μg/ml) with varying incubation time (0.5, 1, 2, 5, 10 and 24 h) (n = 3). MFI indicates mean fluorescence intensity. (d) MFI for SH-GQDs (50 μg/ml) incubated in Raw264.7 cells for 24 h under different conditions, including negative (37°C), 4°C, dextran sulfate (scavenger receptor-A ligands) and ATP-depletion (50 mM 2-deoxy-d-glucose and 25 mM NaN3) (n = 3).
