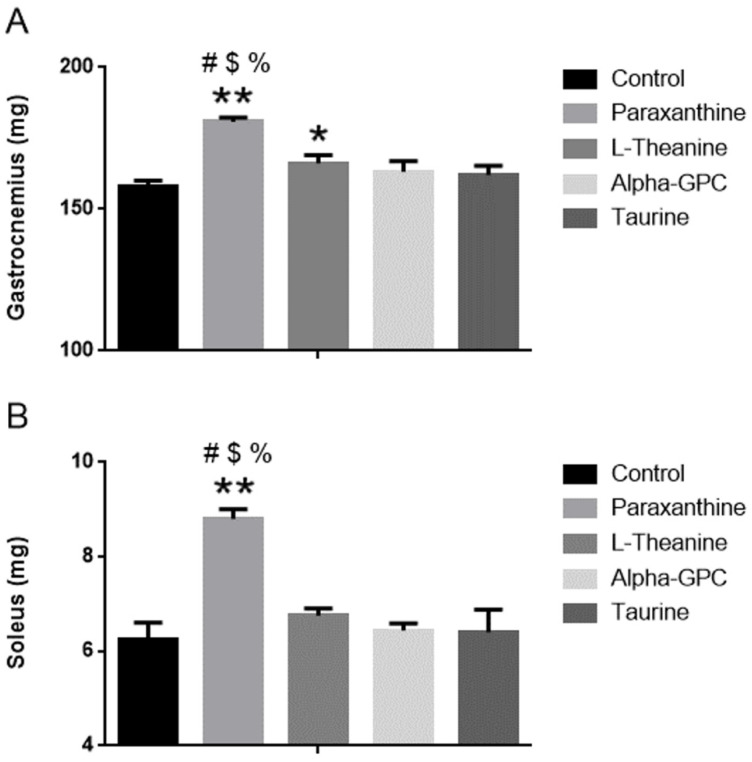
Figure 3.
(A): Gastrocnemius mass (in milligrams) in mice after 28 days of supplementation. (B): Soleus mass (in milligrams) in mice after 28 days of supplementation. * = p < 0.05 vs. control, ** = p < 0.001 vs. control, # = p < 0.001 = vs. L-theanine, $ = p < 0.001vs. alpha-GPC (p < 0.05), % = p < 0.001 vs. Taurine. Data represented by Mean ± SD (n = 8 in each group).

