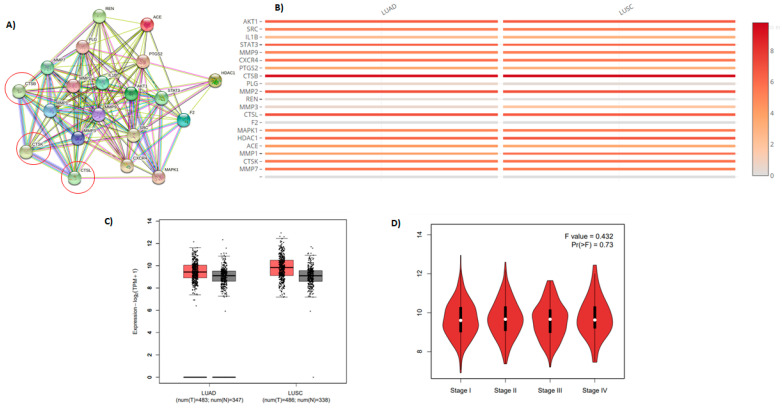
Figure 10.
Bioinformatic analysis: (A) The PPI network of top genes; (B) the top 20 gene comparison in lung adenocarcinoma and lung squamous cell carcinoma; (C,D) Gene Expression Profiling Interactive Analysis (GEPIA), the expression level of CTSB was increased in lung adenocarcinoma and squamous cell lung carcinoma.

