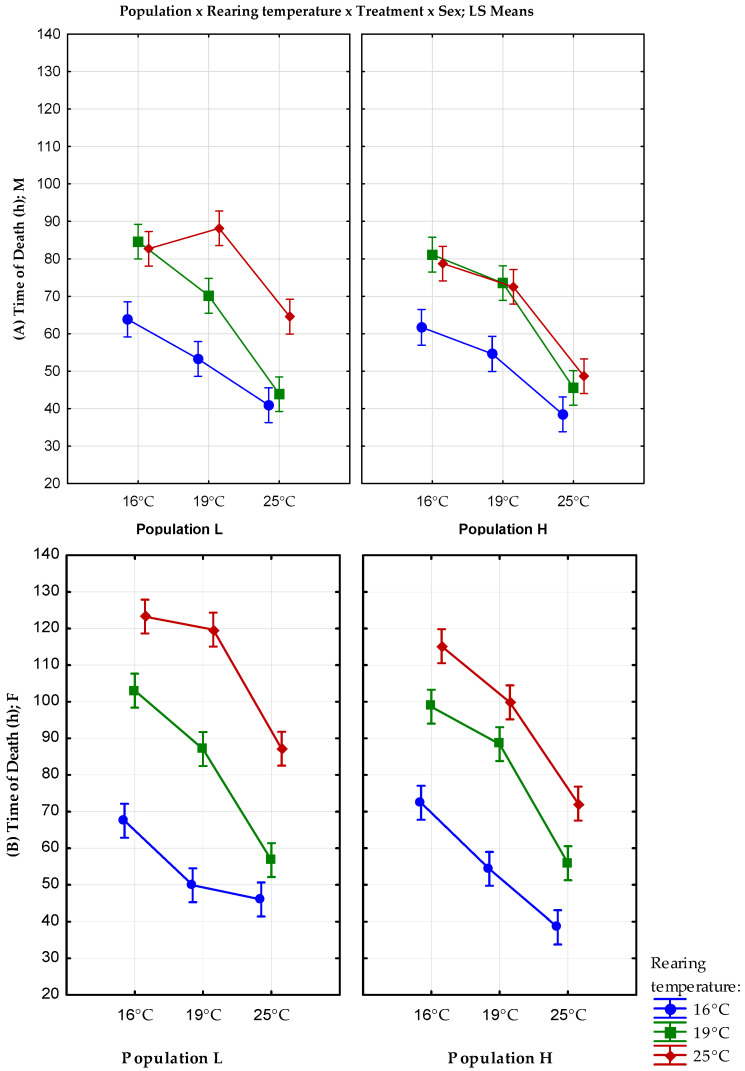
Figure 3.
Results of the full factorial GLM analysis of starvation resistance with fixed factors population, rearing temperature, treatment temperature, and sex; (A) males; and (B) females. Vertical bars denote a 0.95 confidence interval. M—males; F—females; L—population originating from lower altitude; H—population originating from a higher altitude.

