Figure 3.
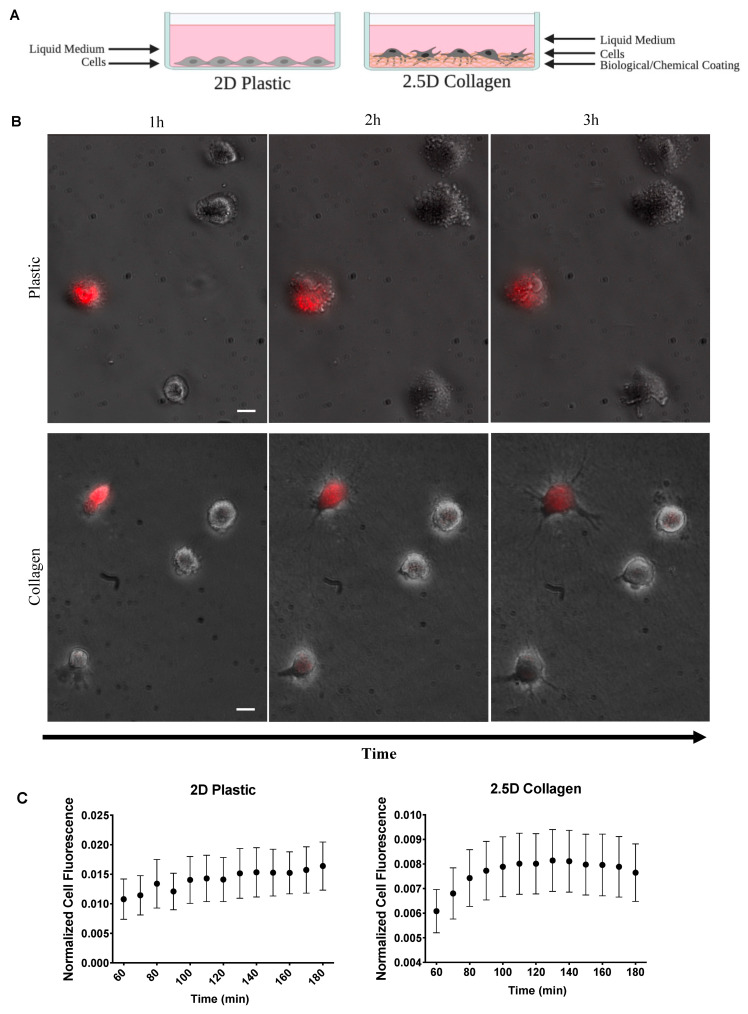
Effects of ECM on mitochondria transfer. (A) Illustration of 2D and 2.5D culture dishes. (B) Two-hour time-lapse of co-cultured stained ADSCs and unstained ADSC plated on 2D plastic and 2.5D collagen (2D n = 25 over 4 independent experiments, 2.5D n = 30, over 2 independent experiments). Scale bar is 20 μm. (C) Normalized mean cell fluorescence of recipient cells plotted every 10 min for two hours for 2D and 2.5D ECM to visualize trend over time.

