Figure 4.
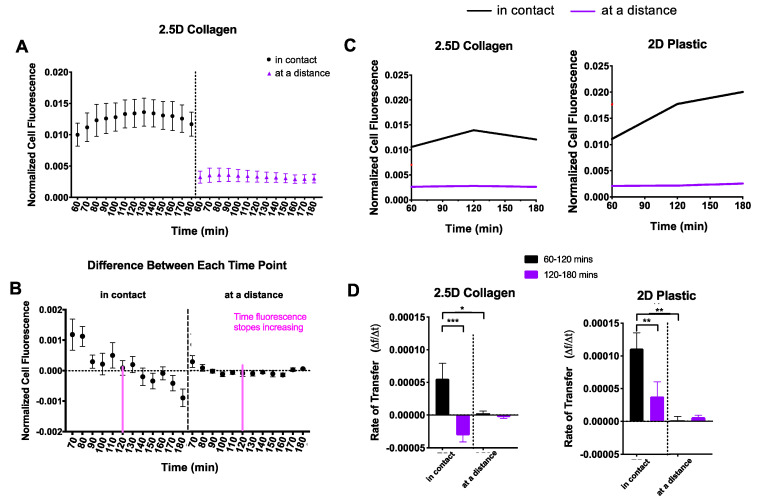
Comparison of 2D and 2.5D culture. Recipient cells were divided into two distance groups based on their distance from donor cells: (i) in contact and (ii) at a distance. (A) For each culture system, normalized cell fluorescence of the recipient cell population was plotted based on distance groups every 10 min for two hours. (B) The difference in fluorescence between each successive timepoint was calculated to determine peak fluorescence. The dotted line indicates a difference of zero and was the threshold used to identify peak fluorescence. This peak is indicated by a pink line (120 min). (C) Data were fit to a segmental linear regression model, intervening at 120 min. (D) Mitochondrial transfer rates were computed and displayed as a function of distance. One-way ANOVA and Tukey’s multiple comparisons test were performed. Significance is presented as * p < 0.05, ** p < 0.01, and *** p < 0.001.

