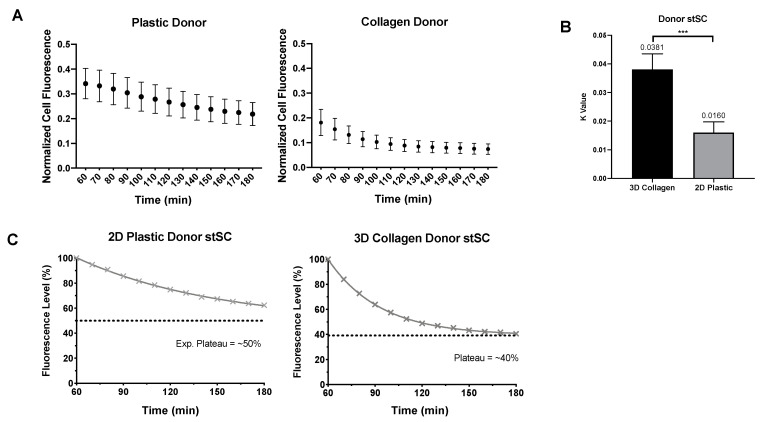
Figure 5.
Comparison of donor 2D and 2.5D culture. (A) Normalized mean cell fluorescence of donor cells in 2D plastic and 2.5D collagen every 10 min for two hours. (B) Each donor cells was fit to an exponential plateau model to obtain k values. Statistical analysis was preformed using a nonparametric Mann–Whitney test. (C) Data were transformed to percentage of fluorescence assuming all cell start with 100% of their own mitochondria. Distinct difference in loss of fluorescence can be visualized between 2D plastic and 2.5D collagen culture. Significance is presented as *** p < 0.001.

