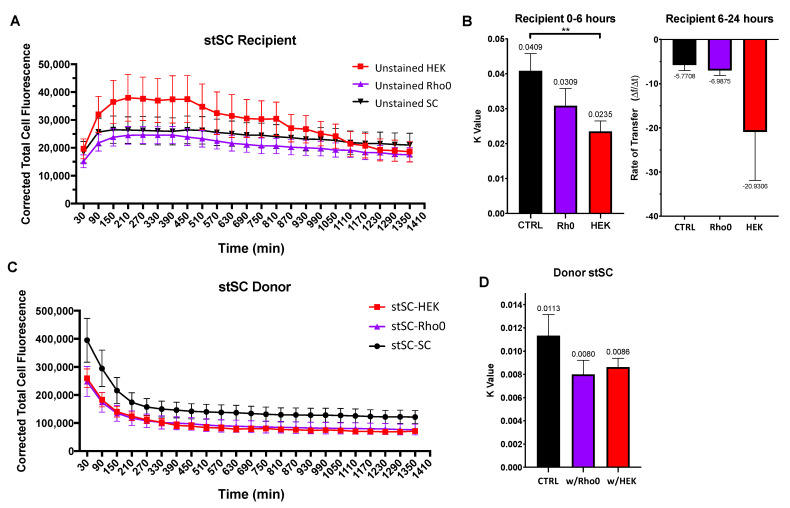
Figure 6.
Effect of tumorigenic cells on SC mitochondria transfer. Cells were cultured in three culture groups (i) stSC–SC (ii) stSC–HEK and (ii) stSC–Rho0. (A) Mean cell fluorescence of recipient cells plotted every 60 min over 24 h. (B) Recipient cell data were split into two periods: (i) 0–6 h and (ii) 6–24 h. For 0–6 h, each cell was fit to an exponential plateau model with a robust regression fit to compute k values; and for 6–24 h, to a robust linear regression to compute transfer rates. Statistical analysis was preformed using the Kruskal–Wallis test to compare to the control group. (SC n = 19, HEK n = 23, Rho0 n = 20, over 3 independent experiments.) (C) Mean cell fluorescence of donor cells plotted every 60 min over 24 h. (D) Each donor cell data were fit to an exponential decay model with a robust regression fit and k values were computed. Statistical analysis was preformed using the Kruskal–Wallis test to compare to the control group. (stSC w/SC n = 23, stSC w/HEK n = 20, stSC w/Rho0 n = 19, over 3 independent experiments.) Significance is presented as ** p < 0.01.

