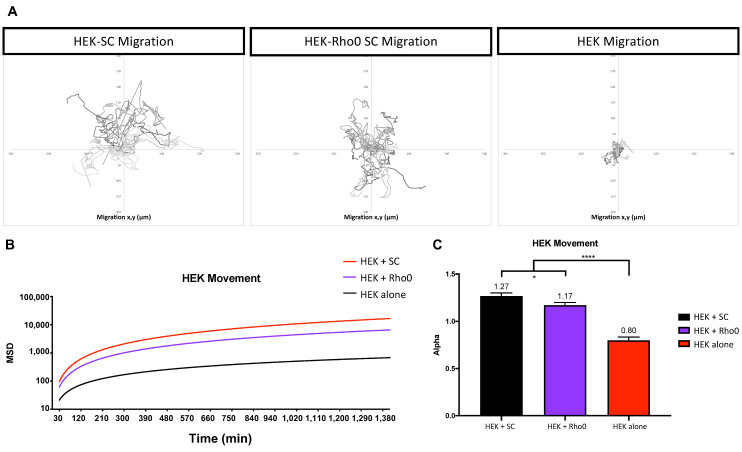
Figure 8.
HEK293 cell migration dependence on external cues. HEK movement was analyzed in three groups (i) HEK cultured with SCs, (ii) HEK cultured with Rho0 SCs and (iii) HEK cultured alone. Culture groups were seeded at a density of 103 cells/cm2. (A) Graphical representation of HEK migration over 24 h using x and y coordinates. (B) MSD fit to a model defined as MSD = t^α, where α is a constant to distinguish between types of movement. (C) Alpha values of each culture group for visualization. Statistical analysis was preformed using one-way ANOVA and multiple comparison (n = 27 for each group, over 2 independent experiments experiments). Significance is presented as * p < 0.05, **** p < 0.0001.

