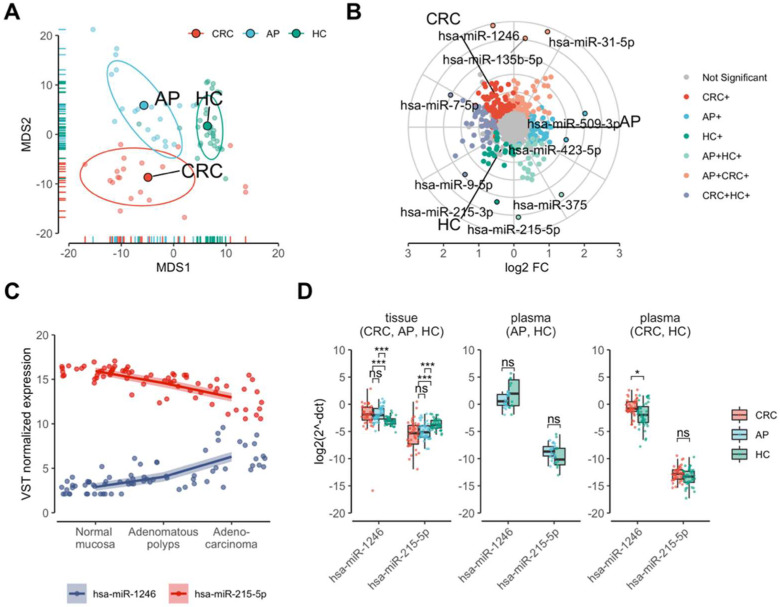
Figure 1.
Expression profiling of miRNAs in precancerous and cancerous tissues of the colon. (A) MDS plot showing three clearly resolved clusters corresponding to colorectal cancer (CRC) and adenomatous polyps (AP) patients and healthy controls (HC). The analysis was performed on normalized miRNA count data using Euclidean distance. (B) A radar plot showing commonly and uniquely deregulated miRNAs (PFDR < 0.01 and |log2FC| > 0.5) among CRC, AP, and HC groups (indicated by colors) in small RNA-seq data. (C) miRNAs highly correlating (absolute value of rSpearman’s > 0.7) with the stages of healthy to adenoma-carcinoma sequence. Spearman’s rank correlation analysis was performed on variance stabilizing transformed miRNA counts. (D) The boxplots display expression levels (delta Ct) of hsa-miR-1246 and hsa-miR-215-5p measured by RT-qPCR in tissue and plasma samples of an independent validation cohort of HC, AP, and CRC individuals. Dots located along the box plots indicate miRNA expression level of each individual in the validation group. Due to the use of different RT-qPCR assays, the results of AP and CRC plasma samples are displayed separately. The ΔCt values were inversed in order to show true direction of the expression. Significance levels: * PFDR < 0.05; *** PFDR < 0.001; ns—not significant.

