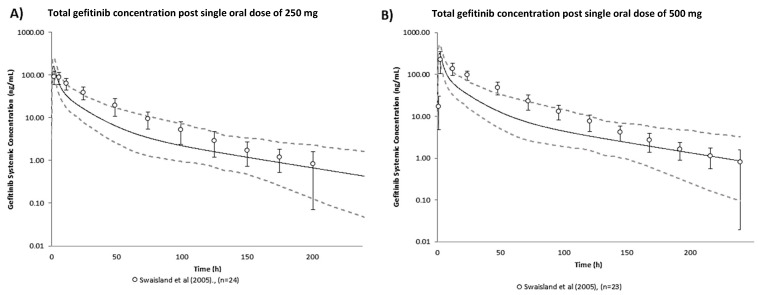
Figure 1.
Verification of the gefitinib human PBPK model: predicted geometric mean (solid black line) and observed geometric mean (data points) ± standard deviation (error bars) of total gefitinib concentration post single oral dose of (A) 250 mg and (B) 500 mg [27]. The dashed lines refer to the predicted 95th percentile range. Virtual population demographic was simulated to be equivalent to the reported study (healthy volunteers, aged 21–57 years old, 0% female, n = 100).

