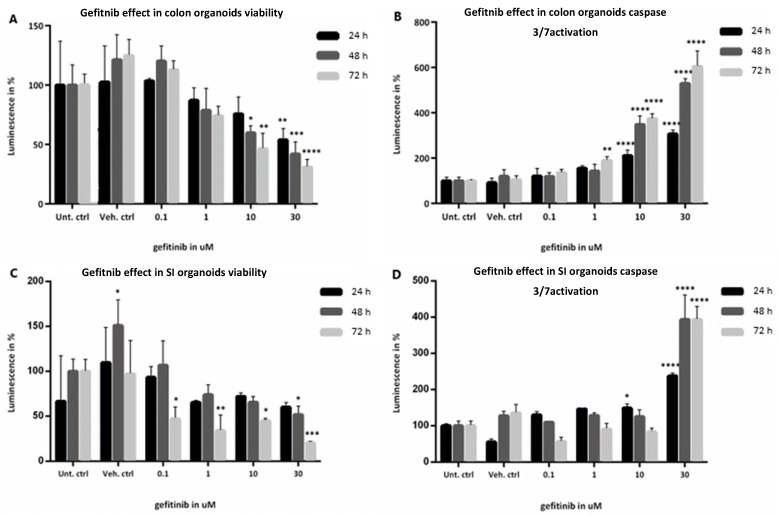
Figure 3.
(A–D): Evaluation of viability determined by ATP levels and caspase 3/7 activation of healthy colon (A,B, respectively) and SI (C,D, respectively) organoids when exposed to 0.1, 1, 10, and 30 µM gefitinib for 24 h in black, 48 h in dark grey and 72 h in light grey, compared with Untreated controls. Values are in % of luminescence. For each time point the average of Unt. Ctrl was set to 100%. SD was calculated for each condition. Legend: Ctrl, control; SD, standard deviation; SI, small intestine; Unt, untreated; Veh, vehicle (with 0.1% DMSO). * p-value = 0.01; ** p-value = 0.003; *** p-value = 0.0004; **** p-value = 0.0001.

