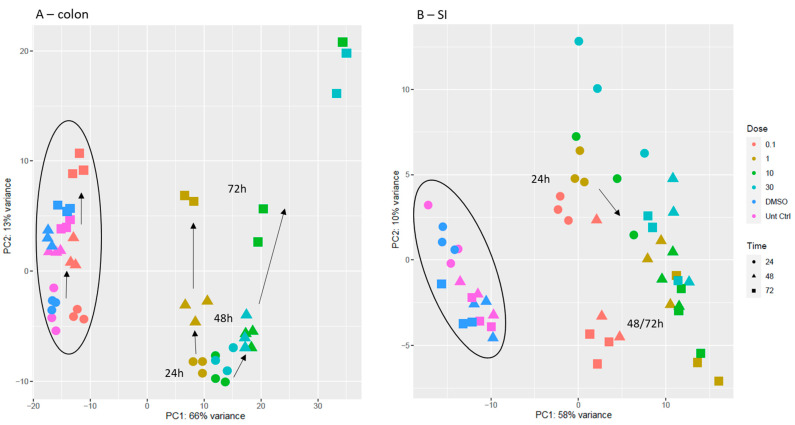
Figure 5.
PCA score scatter plot obtained for the mRNA transcriptomic analysis of samples collected from colon organoids (A) and SI organoids (B). Direction of the arrows indicates the evolution in time of the samples (24 h → 48 h → 72 h). In colon plot, cluster on the left comprises non-treated samples (untreated and vehicle controls); in SI plot, cluster on the left comprises non-treated samples and treated samples with 0.1 µM gefitinib. Legend: untreated controls are in pink; vehicle controls (DMSO) are in dark blue; 0.1 µM gefitinib in red; 1 µM gefitinib in dark yellow; 10 µM gefitinib in green; and 30 µM gefitinib in light blue. Circles represent 24 h; triangles, 48 h; squares, 72 h.

