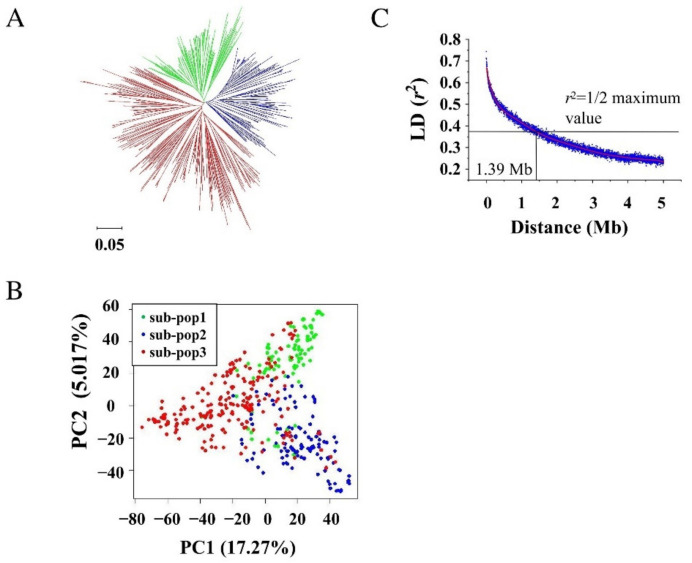
Figure 2.
Population structure (A), principal component analysis (PCA; B), and linkage disequilibrium (LD) decay (C) of the 476 lines of the soybean association panel according to the high-density 61,166 soybean array. The LD parameters, viz., “D’” and “r2” were calculated. The LD decay rate of the population was measured as the chromosomal distance when the average r2 decreased to be half of its maximum value.

