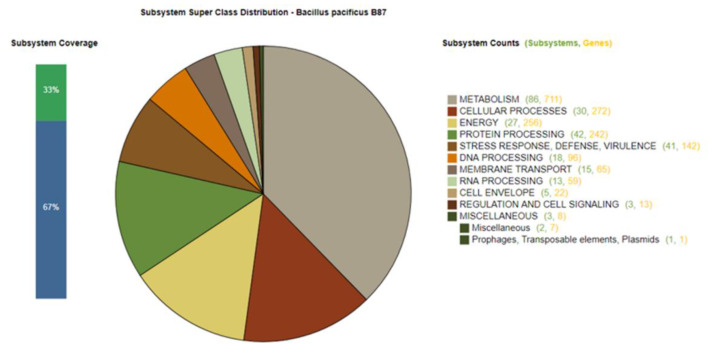
Figure 3.
Overview of the subsystem categories of the annotated draft whole genome of Bacillus sp. B87 from the RAST server. The pie chart shows the number of genes related to individual subsystems. The bar graph on the left reveals the subsystem coverage. The ratio of coding sequences annotated in the SEED subsystem (33%) and outside of the SEED subsystem (67%) is indicated.

