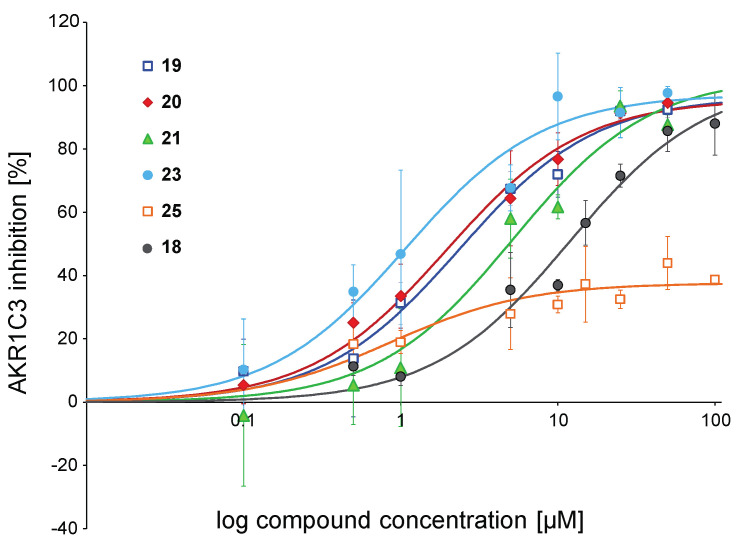
Figure 2.
IC50 curves for selected chalcones. Shown is the inhibition of the ∆4-androstene-3,17-dione reduction catalysed by AKR1C3 at increasing compound concentrations. Data were fitted to the one-site ligand binding equation of the SigmaPlot Kinetics module. Symbols for compounds are shown in the plot. Experiments were performed in triplicates, and mean values ± SD are shown.

