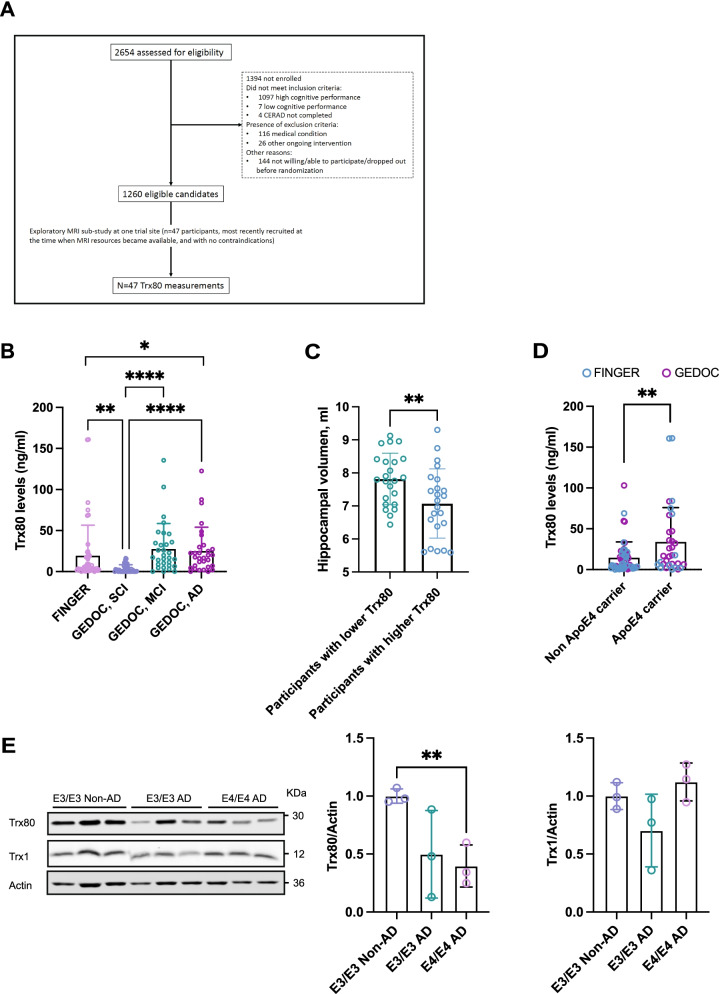
Fig. 1.
A CONSORT diagram of the FINGER exploratory Thioredoxin-80 sub-study. CERAD, Consortium to Establish a Registry for Alzheimer’s Disease. B Serum Trx80 levels by disease diagnosis. Participants were divided into four groups according to their disease state. FINGER cohort participants and SCI, MCI, and AD participants from the GEDOC cohort. The graph shows serum Trx80 levels (ng/ml) between groups. p values are calculated from one-way ANCOVA adjusted for age. C Hippocampal volume of patients with highest and lowest serum Trx80 levels in FINGER cohort. The graph shows hippocampal volume (ml) between groups. t-test was used to analyze the differences between groups. D Serum Trx80 levels in ApoE4 carriers and non-carriers from merged GEDOC and FINGER cohorts. The graph shows serum Trx80 levels (ng/ml) between groups. p values are calculated from one-way ANCOVA adjusted for age. E Western-bot analysis of Trx80 levels in post-mortem AD and non-AD brain samples. Samples are sorted by APOE genotype ApoE3/ApoE3 (E3/E3) and E4/E4. Student t-test was used to analyze the differences between groups. *p < 0.05; **p < 0.01; ****p < 0.0001

