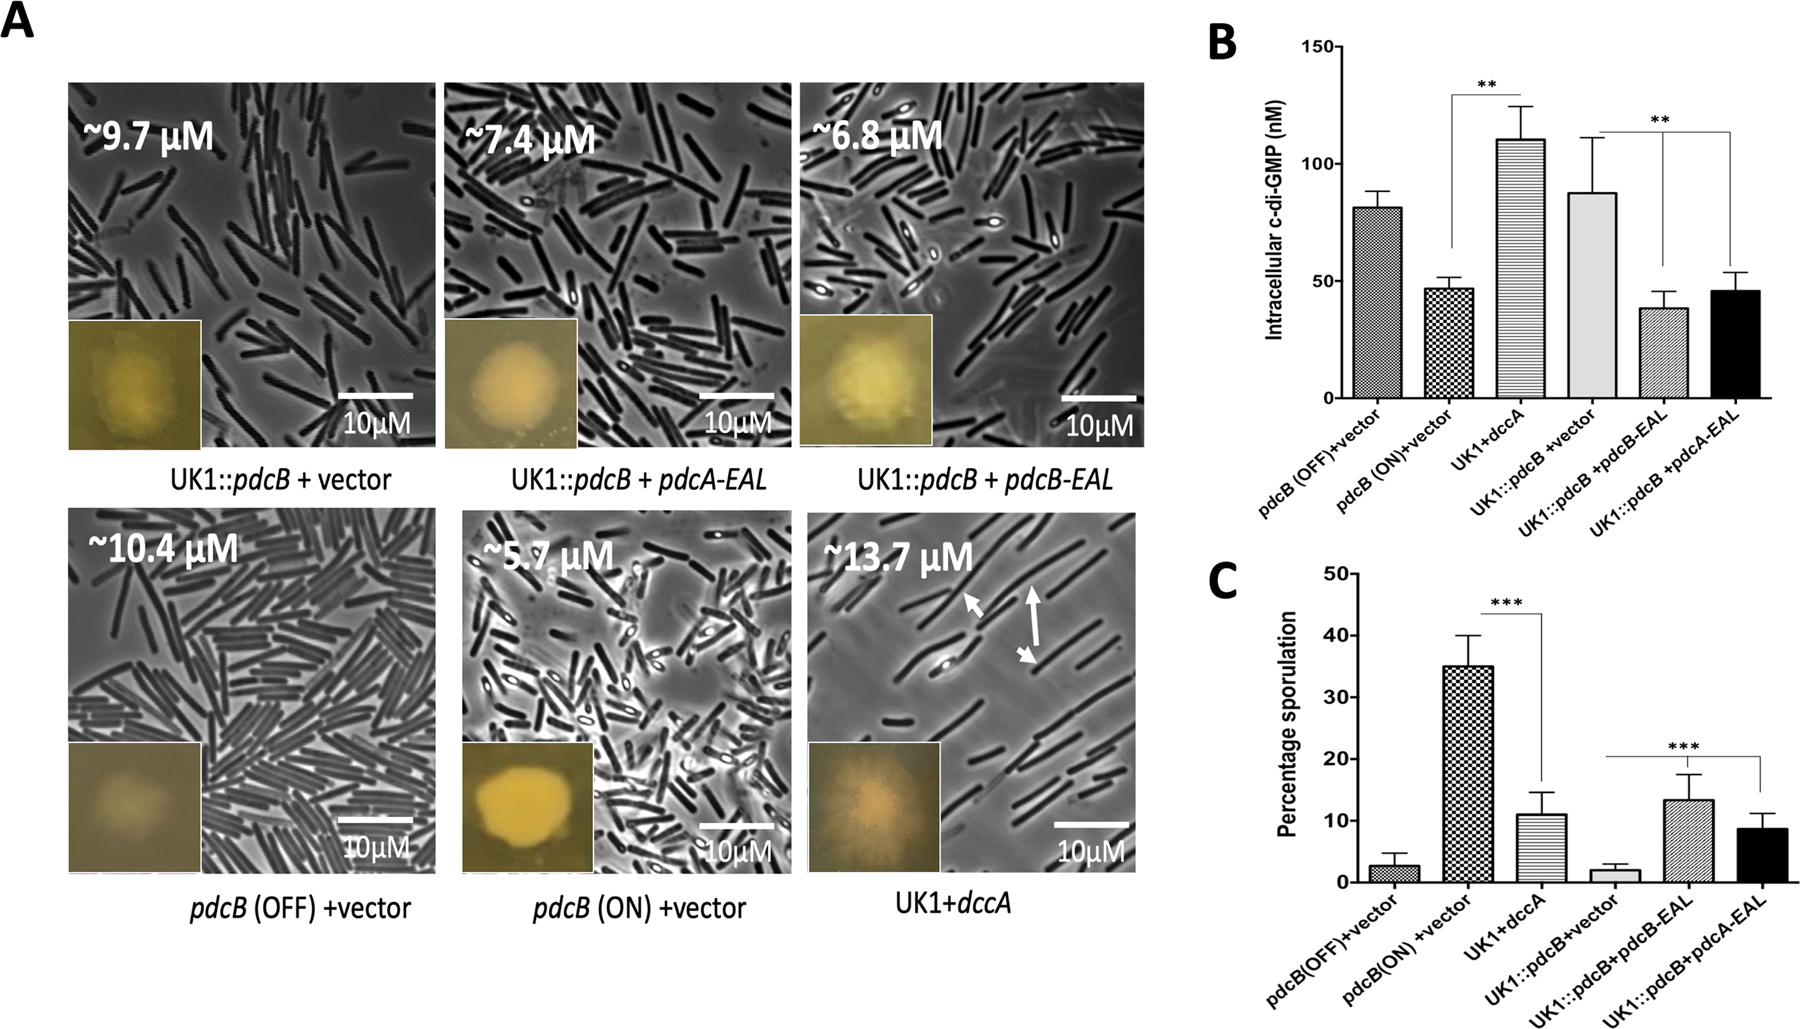
Figure 5. Intracellular c-di-GMP levels influence sporulation in UK1 strain.

A. Phase-contrast microscopic images along with colony morphology of pdcB (OFF), pdcB (ON), UK1 expressing dccA, UK1::pdcB mutant complemented with pdcB-EAL/ pdcA-EAL. Average cell length is marked at the upper right corner of each image. Using ImageJ software, at least three images from two replicates were used for measuring the cell length (n=100). Long cells appeared upon the induction of dccA were marked with white arrows. The intracellular levels of c-di-GMP (B) and sporulation percentage (C) were measured in these strains. To induce the expression of dccA, pdcB-EAL, pdcA-EAL 100 ngs/ml of ATc was included in the TY agar plates. Three biological replicates were used and data were analyzed by one-way analysis of variance (ANOVA) where ** indicates p<0.05, and *** indicates p<0.005.
