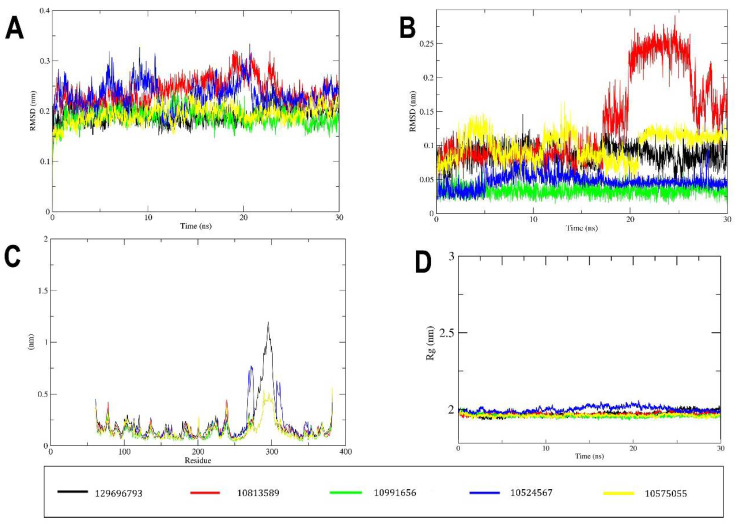
Figure 5.
MD simulation results of the docked flavonoids obtained from virtual screening. (A) Root–mean–square deviation (RMSD) curve for the protein backbone of the protein–ligand complex. The RMSD plot provides quantification of the overall stability of the protein backbone during 30 ns simulation. (B) RMSD curve for ligands’ heavy atoms through the simulation. (C) Root–mean–square fluctuations’ (RMSF) curve of the MEK1 residues for the protein–ligand complexes. (D) Radius of gyration (total) of protein–ligand complex.

