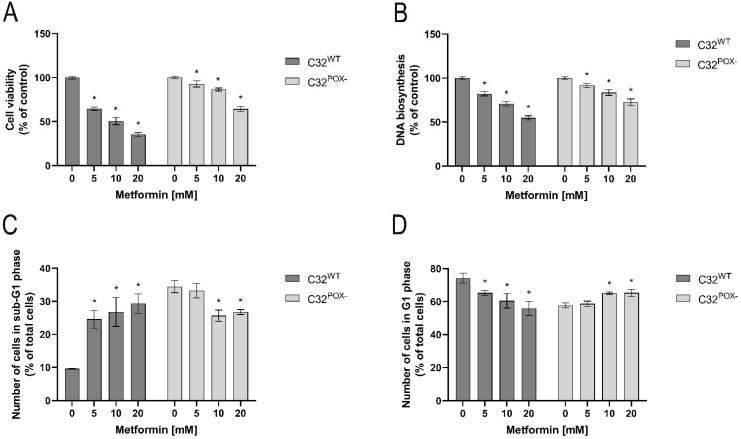
Figure 1.
Cell viability (A), DNA biosynthesis (B), analysis of sub-G1 (C) and G1 (D) phases of cell cycle in C32 and C32POX− cells upon treatment with metformin (0–20 mM, 24 h). The mean values with standard deviation (SD) from 3 experiments performed in duplicates are presented. Asterisks * indicate statistical differences between studied cells compared to controls at p < 0.001.

