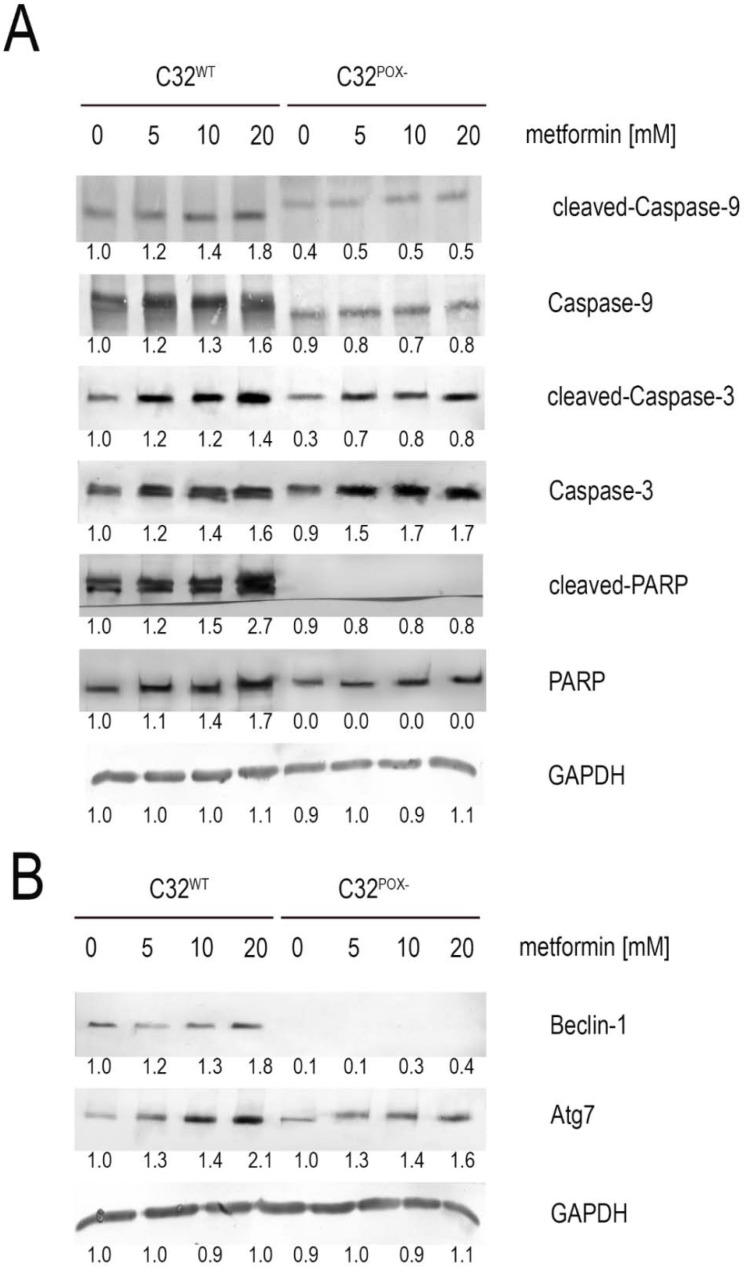
Figure 3.
Expression of (A) apoptosis markers (cleaved-Caspase-9, Caspase-9, cleaved-Caspase-3, Caspase-3, cleaved-PARP, and PARP) and (B) autophagy markers (Beclin-1 and Atg7). Representative Western blot images are shown (the mean values of densitometric analysis after GAPDH normalization as a ratio versus control were presented below each blot). Supplementary Materials contain statistical analysis of the evaluated proteins (Supplementary Material, Figures S3–S8).

