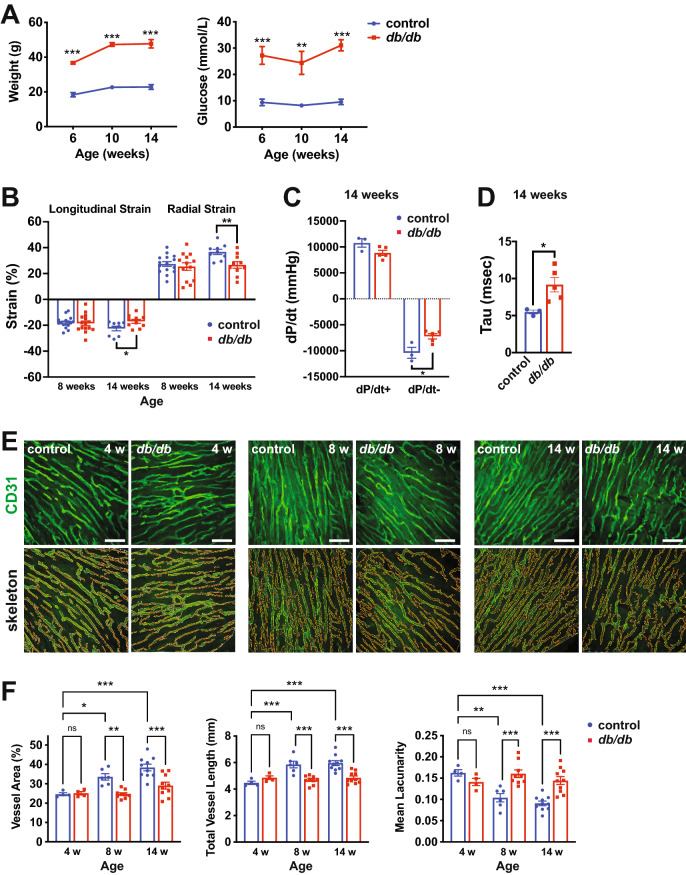
Fig. 1.
Diabetic mice develop diastolic dysfunction accompanied by microvascular rarefaction in the left ventricle. A Fasting blood glucose levels and body weight in db/db mice and db/ + controls at 6, 10 and 14 weeks of age. n = 4–5 mice per group. ** and *** indicate p < 0.01 and p < 0.001, respectively, for db/db vs. db/ + controls at the specified timepoint using an unpaired t-test. B Longitudinal and radial strain analysis at 8 and 14 weeks in db/db mice and db/ + controls. * and ** indicate p < 0.05 and p < 0.01, respectively for db/db vs. db/ + controls at the specified timepoint using an unpaired t-test. C Pressure–Volume (PV) loop analysis at 14 weeks in db/db mice and db/ + controls, depicting the dP/dt maximum (dP/dt +) and minimum (dP/dt-) values. * indicates p < 0.05 for db/db vs. db/ + using an unpaired t-test. D Tau measurements, indicative of the exponential decay of the ventricular pressure during isovolumetric relaxation, from PV loop analysis at 14 weeks in db/db mice and db/ + controls. * indicates p < 0.05 for db/db vs. db/ + using an unpaired t-test. E 2-photon confocal microscopy of cardiac microvasculature in the left ventricle as assessed by CD31 immunofluorescence at 4, 8 and 14 weeks in db/db mice and db/ + controls. The top images are CD31 immunofluorescence and the bottom are the skeleton outlines of the microvasculature. Representative images are shown. Scale bar = 45 μm. F Quantification of microvascular density, as assessed by measurement of microvascular area, total vessel length, and mean lacunarity in 4-, 8- and 14-week db/db and db/ + control mice. Each data point represents the mean of multiple fields of view from one mouse. *, ** and *** indicate p < 0.05, p < 0.01 and p < 0.001, respectively for the specified comparisons using ANOVA with Holm-Sidak multiple comparisons test. NS = not significant. All data in the figure depict mean ± SEM

