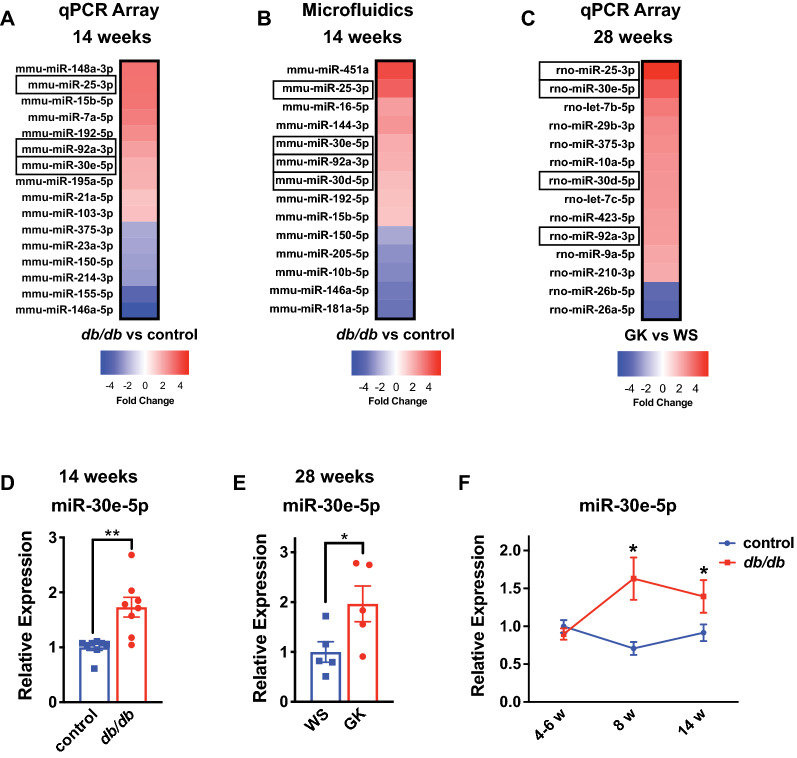
Fig. 3.
Extracellular vesicle miRNAs are differentially abundant in T2D models. A Heat map of differentially abundant miRNAs (unpaired t-test) in EVs isolated from db/db mice and db/ + controls at 14 weeks using a qRT-PCR array. n = 4. B Heat map of differentially abundant miRNAs (unpaired t-test) in EVs isolated from db/db mice and db/ + controls at 14 weeks using a microfluidics platform. n = 4. C Heat map of differentially abundant miRNAs in EVs isolated from Goto-Kakizaki (GK) rats and Wistar (WS) controls at 28 weeks using a qRT-PCR array. n = 3. In panels A-C, miR-25-3p, miR-30d-5p, miR-30e-5p, miR-92a-3p are highlighted, as these were common among platforms and between mouse and rat models of T2D. D qRT-PCR validation of miR-30e-5p expression in EVs isolated from db/db mice and db/ + controls at 14 weeks. Data is relative to the mean of the control group. ** indicates p < 0.01 for db/db vs. db/ + using an unpaired t-test. E qRT-PCR validation of miR-30e-5p expression in EVs isolated from GK rats and WS controls at 28 weeks. Data is relative to the mean of the WS control. * indicates p < 0.05 for GK vs. WS using an unpaired t-test. F Time-course analysis of miR-30e-5p expression in db/db mice and db/ + controls at 4–6, 8 and 14 weeks. Data is relative to the mean of the control 4–6 week time-point group. n = 4–5 mice per time-point and genotype. * indicates p < 0.05 for db/db vs. db/ + at the specified timepoint using an unpaired t-test. See Additional File 1: Fig. S4 for individual data points for the heat maps in (A), (B) and (C). All data in the figure depict mean ± SEM

