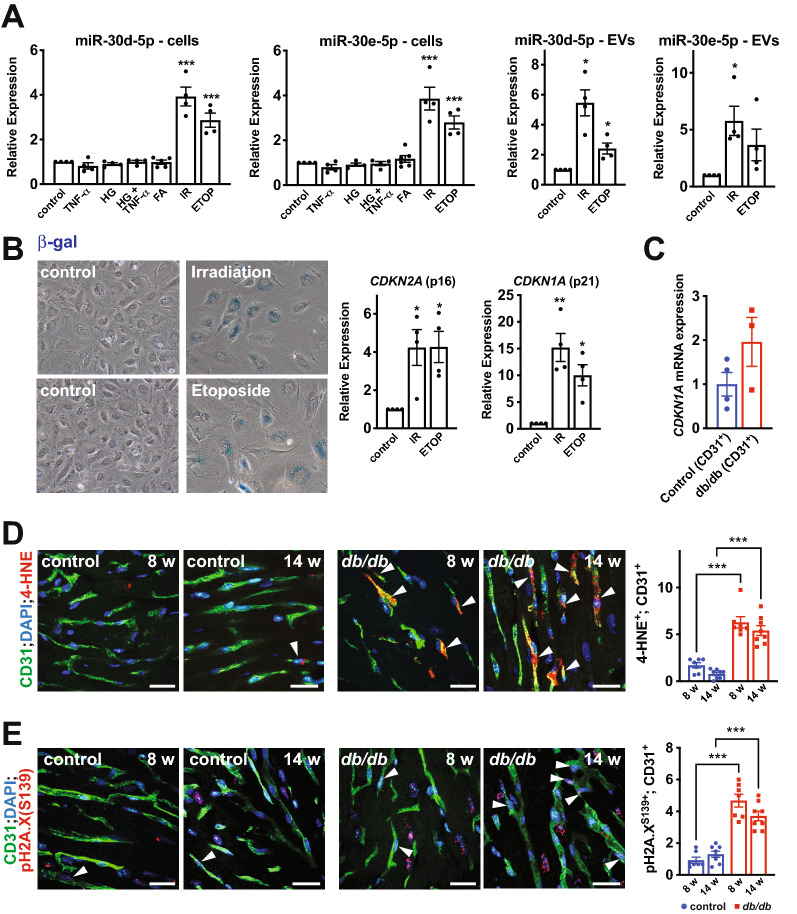
Fig. 5.
Senescence pathways induce miR-30d/e expression and secretion from ECs. A Left; qRT-PCR of miR-30d and miR-30e in cultured human umbilical vein ECs (HUVECs) exposed to diabetic stimuli (i.e. TNFα (10 ng/mL), high glucose [HG] (20 mM), TNFα + high glucose or the fatty acid, palmitate [FA] (40 μM)) or senescence-inducing stimuli (i.e. irradiation [IR] or etoposide [ETOP]). *** indicates p < 0.001 for the specified stimulus vs. vehicle control using ANOVA with Holm-Sidak multiple comparisons test. Right; secretion of miR-30d or miR-30e as assessed by qRT-PCR of EVs secreted by HUVECs exposed to senescence-inducing stimuli. * indicates p < 0.05 for the specified stimulus vs. vehicle control using ANOVA with Holm-Sidak multiple comparisons test. Data is relative to the control for each independent experiment. B Representative staining for senescence-associated β-gal activity and qRT-PCR for CDKN2A (p16) and CDKN1A (p21) expression in HUVECs exposed to irradiation [IR] or treated with etoposide [ETOP]. Data is relative to the control for each independent experiment. C qRT-PCR of CDKN1A (p21) expression in CD31+ cells isolated from db/db and db/ + control hearts at 14 weeks of age. Representative images of immunofluorescent staining for 4-HNE and CD31 (D) and pH2A.X (S139) and CD31 (E) in the left ventricle of 8- and 14-week db/db mice and db/ + controls. Scale bar = 22 μm. Arrowheads indicate examples of 4-HNE+ or pH2A.X+ ECs. Quantification of 4-HNE+;CD31+ double-positive ECs and pH2A.X+;CD31+ double-positive ECs per field of view is shown to the right. Each data point represents the mean of multiple fields of view from one mouse. *** indicates p < 0.001 for the specified comparison using ANOVA with Holm-Sidak multiple comparisons test. All data in the figure depict mean ± SEM

