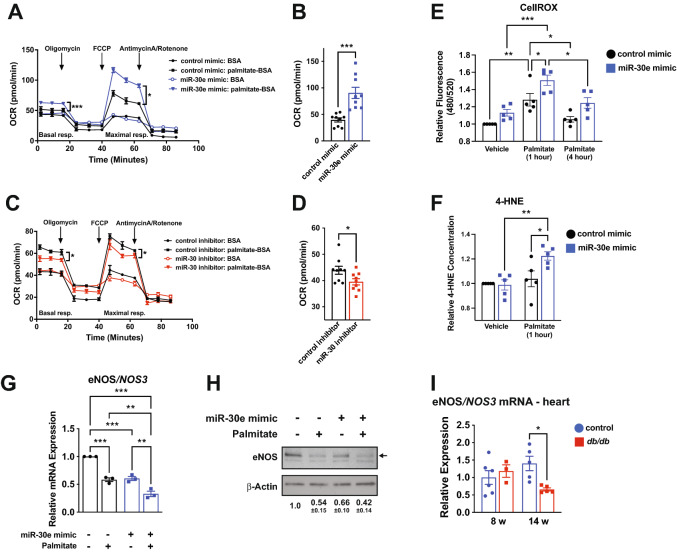
Fig. 7.
miR-30 enhances exogenous fatty acid β-oxidation and promotes oxidative stress and EC dysfunction. A Representative Seahorse tracing of oxygen consumption rate (OCR) in control and miR-30e over-expressing ECs. Basal and maximal respiration of exogenous, but not endogenous FA, was enhanced in miR-30e over-expressing cells. Error bars depict 2–3 technical replicates from a representative experiment. * and *** indicate p < 0.05 and p < 0.001, respectively, for the specified comparison using ANOVA with Holm-Sidak multiple comparisons test. Technical replicates were averaged and the value at each timepoint for basal and maximal respiration was used for paired statistical analyses (n = 3). B Quantification of exogenous FA oxidation (maximum OCR after FCCP injection minus minimum OCR after AntA/rotenone) in ECs over-expressing miR-30e. n = 3 independent experiments with 3 technical replicates. *** indicates p < 0.001 for miR-30e mimic vs. control mimic using an unpaired t-test. C Representative Seahorse tracing of OCR in control and miR-30 knock-down ECs. Basal and maximal respiration of exogenous FA was reduced by miR-30 knock-down. Error bars depict 2–3 technical replicates from a representative experiment. * indicates p < 0.05 for the specified comparisons using ANOVA with Holm-Sidak multiple comparisons test. Technical replicates were averaged and the value at each timepoint for basal and maximal respiration was used for paired statistical analyses (n = 3). D Quantification of exogenous FA oxidation in ECs with miR-30 knock-down. n = 3 independent experiments with 3 technical replicates. * indicates p < 0.05 for miR-30 inhibitor vs. control inhibitor using an unpaired t-test. E Measurement of reactive oxygen species (ROS) in ECs transfected with control or miR-30e mimic exposed to palmitate. Basal and palmitate-induced ROS production was increased in miR-30e over-expressing cells. Data is relative to the unstimulated control for each independent experiment. *, ** and *** indicate p < 0.05, p < 0.01 and p < 0.001, respectively, for the specified comparisons using ANOVA with Holm-Sidak multiple comparisons test. NS = not significant. F 4-HNE measurements in vehicle or palmitate stimulated ECs transfected with control or miR-30e mimic. Data is relative to the unstimulated control for each independent experiment. * and ** indicate p < 0.05 and p < 0.01, respectively for the specified comparisons using ANOVA with Holm-Sidak multiple comparisons test. G qRT-PCR measurement of eNOS/NOS3 mRNA in cultured ECs transfected with control or miR-30e mimic in the presence or absence of palmitate. Data is relative to the unstimulated control for each independent experiment. ** and *** indicate p < 0.01 and p < 0.001, respectively, for the specified comparisons using ANOVA with Holm-Sidak multiple comparisons test. H Representative western blot demonstrating a reduction in eNOS protein in ECs over-expressing miR-30e and exposed to palmitate. Densitometry is included below from n = 5 independent experiments (mean ± SEM). I qRT-PCR measurement of eNOS/NOS3 mRNA in the left ventricle of db/db mice and db/ + controls at 8 and 14 weeks of age. Data is relative to the mean of control samples at 8 weeks of age. * indicates p < 0.05 for the specified comparison using ANOVA with Holm-Sidak multiple comparisons test. All data in the figure depict mean ± SEM

