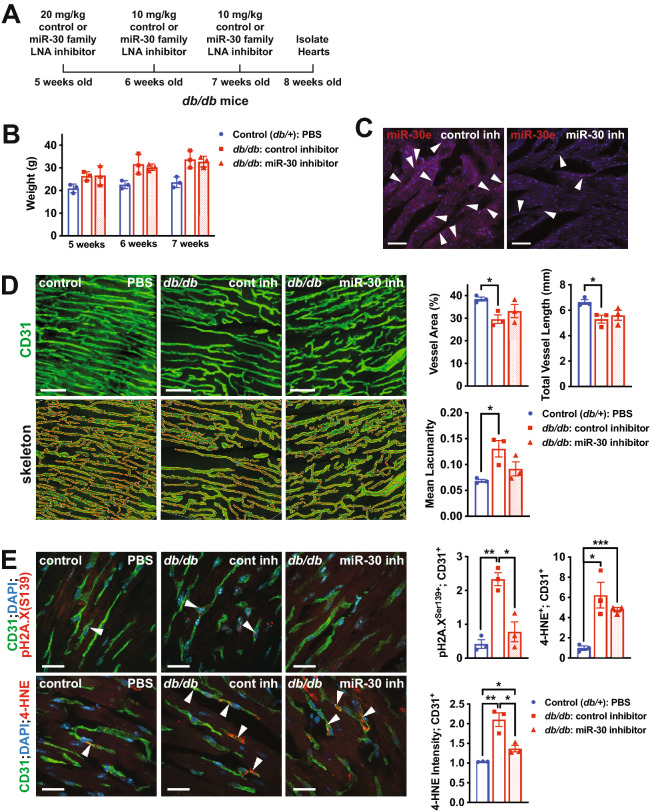
Fig. 8.
Inhibition of miR-30 decreases oxidative stress and DNA damage in microvascular endothelial cells in db/db mice. A Schematic of experimental set-up. Control or miR-30 family LNA inhibitor was injected intradermally in db/db mice at 5, 6 and 7 weeks of age and hearts were harvested at 8 weeks of age. Control (db/ +) mice were injected with PBS at the same time-points. B Weights were measured at the time of injections, revealing normal weight gain in db/db mice injected with miR-30 inhibitor. C Confocal imaging of miRNAscope of miR-30e in left ventricles from db/db mice injected with control or miR-30 family LNA inhibitor. Arrowheads indicate expression in cells that are presumed to be endothelial cells based on morphology and anatomy. Representative images are shown. Scale bar = 50 μm. D 2-photon confocal microscopy of cardiac microvasculature in the left ventricle as assessed by CD31 immunofluorescence at 8 weeks of age in db/db mice (injected with control or miR-30 family LNA inhibitor) (right panels) and controls (db/ +) (left panel). The top images are CD31 immunofluorescence and the bottom are the skeleton outlines of the microvasculature. Representative images are shown. Scale bar = 45 μm. Quantification of microvascular density, as assessed by measurement of microvascular area, total vessel length, and mean lacunarity (right). Each data point represents the mean of multiple fields of view from one mouse. * indicates p < 0.05 for the specified comparisons. E Representative images of immunofluorescent staining for pH2A.X (S139) and CD31 (top) and 4-HNE and CD31 (bottom) in the left ventricle in db/db mice (injected with control or miR-30 family LNA inhibitor) (right panels) and controls (db/ +) (left panel) at 8 weeks of age. Scale bar = 22 μm. Arrowheads indicate examples of 4-HNE+ or pH2A.X+ ECs. Quantification of pH2A.X+;CD31+ double-positive ECs, 4-HNE+;CD31+ double-positive ECs and 4-HNE intensity in ECs is shown to the right. Each data point represents the mean of multiple fields of view from one mouse. *, ** and *** indicates p < 0.05, p < 0.01 or p < 0.001, respectively for the specified comparisons. All data in the figure depict mean ± SEM

