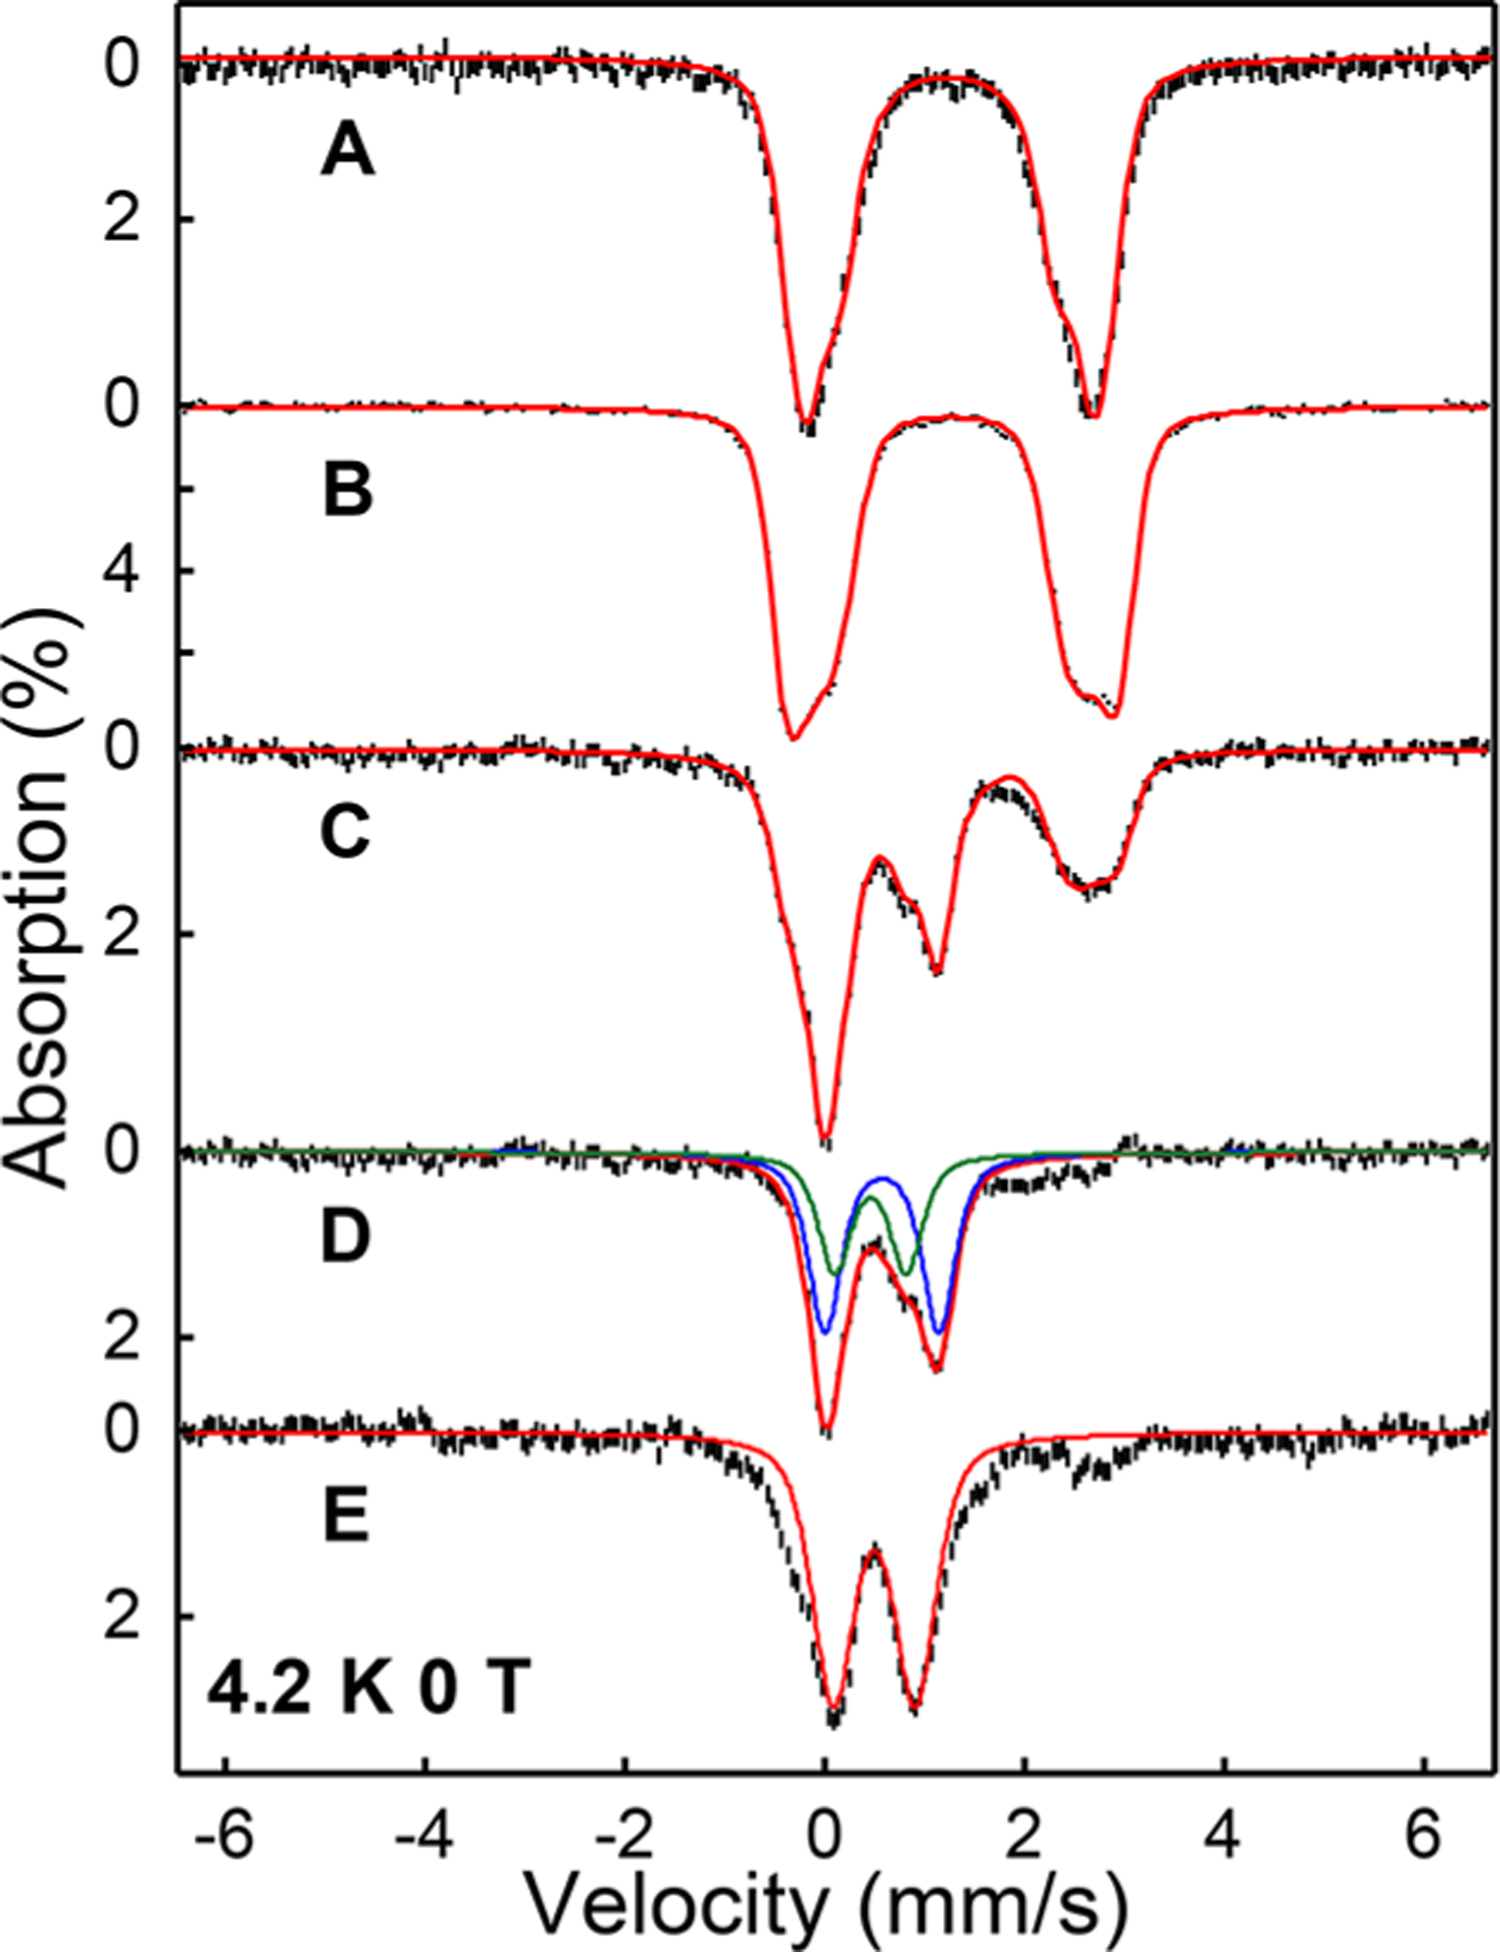
Figure 3.

Mössbauer spectroscopy of BesC-P. (A) Zero-field, 4.2 K Mössbauer spectra of diferrous BesC, (B) 4-Cl-Lys-bound diferrous BesC, (C) the oxygenated 4-Cl-Lys-bound diferrous BesC frozen at 1 min, (D) the difference spectrum generated by subtracting 40% (B) from (C), and (E) fully decayed BesC-P. The red solid lines are the overall spectral simulations; the simulation parameters are listed in Table 1 and Table S5. For (D), the blue and the green lines represent the spectral simulation of BesC-P (Species I) and the initial product complex (Species II), respectively.
