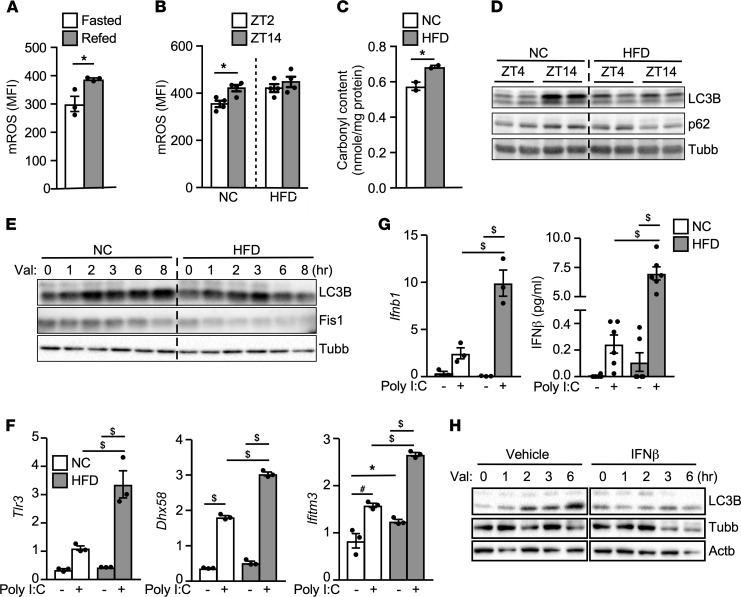
Figure 1. Overnutrition induces oxidative stress and impairs mitophagy in the liver.
(A) Liver mROS production in fasted/refed mice. Mice were fasted overnight, followed by a 5-hour fasting or refeeding. Liver mitochondria were stained with MitoSOX Red plus 20 mM sodium succinate (to induce mROS production) for FACS analysis. MFI, mean fluorescence intensity from FACS analysis. n = 3, experiments repeated twice. (B) mROS levels in liver mitochondria isolated at diurnal fasting (Zeitgeber time 2, or ZT2 = 8 am) and feeding (ZT14 = 8 pm) periods. Mice were fed a NC or HFD for 8 weeks. n = 3–5, experiments repeated twice. (C) Protein carbonyl content in livers of NC- or HFD-fed mice at ZT2, repeated twice. (D) LC3B and p62 immunoblotting in NC or HFD livers at ZT4 and ZT14. n = 2, repeated twice. Beta tubulin (Tubb) included for loading control. (E) LC3B and Fis1 immunoblotting in primary hepatocytes from NC- or HFD-fed mice with 10 μM valinomycin at indicated time points, repeated 3 times. (F) Relative expression of IFN-I signaling genes by real-time PCR. Primary hepatocytes from NC- or HFD-fed mice were transfected with/without 100 ng/well Poly I:C for 16 hours. n = 3, repeated 3 times. (G) Ifnb1 gene expression (n = 3) and IFN-β protein secretion (n = 6, normalized to cellular protein content) from the condition described in F. (H) LC3B immunoblotting in primary hepatocytes stimulated with 10 ng/mL IFN-β for 16 hours, followed by 10 μM valinomycin time course treatment. Tubb and beta actin (Actb): loading controls. Experiments repeated twice. Values are mean ± SEM. Significance of A–C were determined by unpaired, 2-tailed Student’s t test; and of F and G by 1-way ANOVA followed by Holm-Šidák multiple comparisons test. *P < 0.05; #P < 0.01; $P < 0.001.

