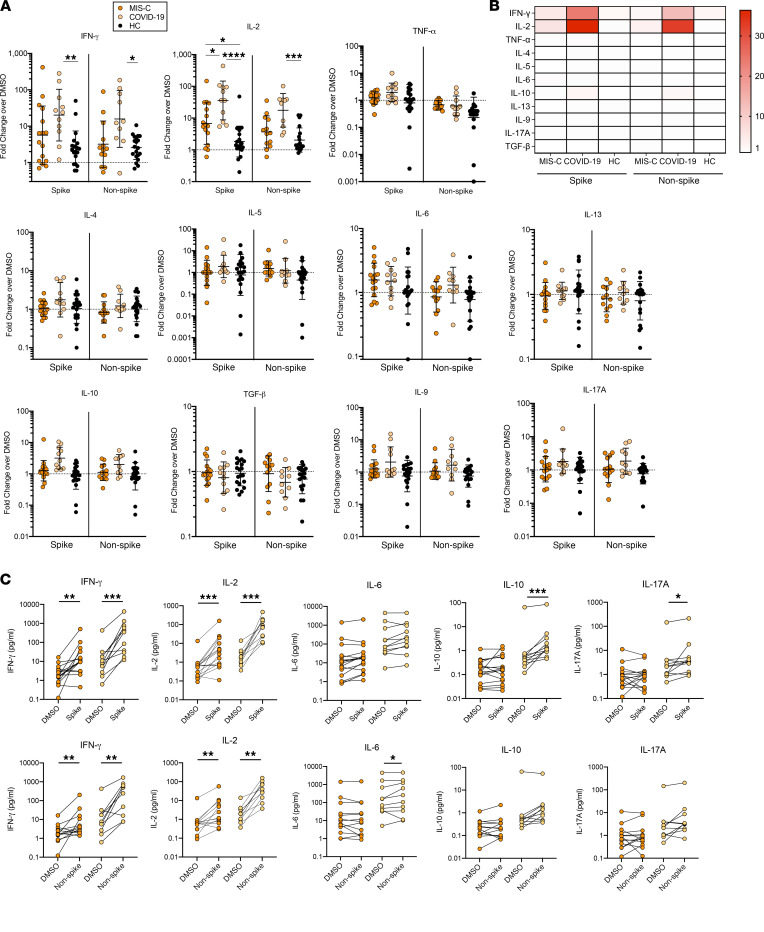
Figure 3. SARS-CoV-2–specific CD4+ T cell cytokine profiling.
(A) Cytokine production for major T helper cytokines shown as fold change (FC) of cytokine concentration after CD4_ S MP (spike-containing) and CD4_R MP (non-spike) stimulation versus DMSO control measured on a subset of participants by MSD multiplex cytokine array. Individual results for MIS-C (n = 19), convalescent COVID-19 (n = 12), and HC (n = 20) are plotted with geometric mean ± SDs. Statistical comparison between groups was conducted by Kruskal-Wallis test. (B) Heatmap showing CD4+ T cell cytokine response by median FC in cytokine production for each peptide MP by clinical cohort. (C) Cytokine concentrations from DMSO control and pair-matched peptide stimulation (Top, spike-containing MP; bottom, non-spike MP) for MIS-C and convalescent COVID-19. Cytokines with significant increases after stimulation are shown. Statistical comparison using Wilcoxon matched-pairs signed rank test. *P < 0.05, **P < 0.01, ***P < 0.001, ****P < 0.0001.

