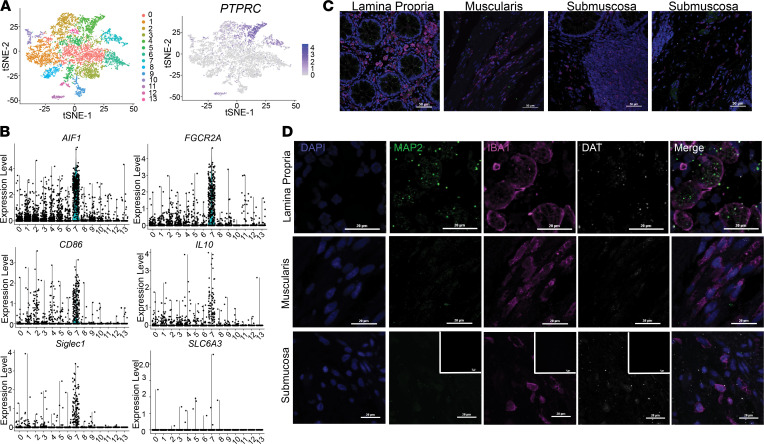
Figure 4. A subpopulation of human intestinal macrophages express DAT.
(A) A previously published single-cell RNA-Seq data set was procured from NCBI’s GEO using the search terms “gut” and “macrophage”. The data set was analyzed using the R package Seurat to cluster the cells based off the 10 most significant principal components and dimensionally reduce the data using t-distributed stochastic neighbor embedding (t-SNE) plots yielding 13 different clusters of cells (left). Relative expression of PTPRC (CD45) was overlaid on the t-SNE plot (right). (B) Relative expression of macrophage markers AIF1/IBA1, FGCGRA, IL-10, CD86, and SIGLEC1 in addition to expression of SLC6A3 (DAT) in each of the 13 clusters represented as violin plots indicate that cluster 7 was enriched for macrophage markers and contained some SLC6A3-expressing cells. (C) Representative 40× confocal microscopy images of healthy human colon tissue labeled for IBA1 (macrophages), MAP2 (neurons), DAPI (nuclei), and DAT. Images were collected from various anatomical parts of the gut wall including the lamina propria (left), muscularis (middle-left), submucosa containing gut-associated lymphoid tissue (middle-right), and submucosa containing neuronal ganglia (right). All areas contained IBA1+ cells (macrophages). (D) High-magnification images from each of the anatomical regions shown in C. Lamina propria contained IBA1+ cells and IBA1+ cells enveloping MAP2+ areas. Some but not all submucosal IBA1+ cells were weakly DAT+, whereas muscularis macrophages were DAT–. Secondary-only negative controls shown as inset in the bottom of D. Images in C and D are from 3 independent experiments from 1 healthy human donor.

