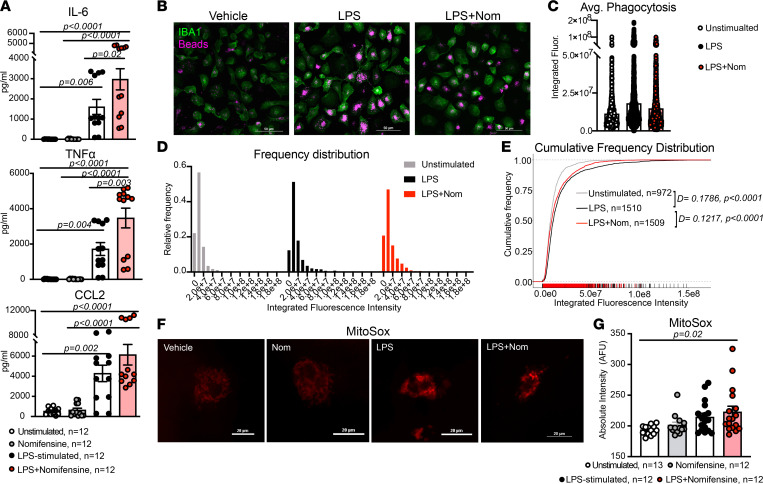
Figure 5. Inhibition of DAT enhances the proinflammatory program in response to LPS.
(A) Cultured human macrophages were treated with vehicle, nomifensine, LPS, or LPS + nomifensine in the presence of NET/SERT blockade. LPS treatment significantly increased the secretion of all 3 soluble factors (IL-6, P = 0.02; TNF-α, P = 0.004; CCL2, P = 0.002). Nomifensine in the presence of LPS significantly increased the LPS-induced secretion of TNF-α (P = 0.003) and IL-6 (P = 0.02) and had a similar effect on CCL2 secretion. Data are from n = 12 experiments/group, and statistics were performed using a 1-way ANOVA with Tukey’s post hoc test. (B) Representative 40× images of cultured human macrophages treated with vehicle (media), LPS, or LPS + nomifensine and incubated with fluorescent latex beads, fixed, and labeled for IBA1. (C) The average integrated fluorescence intensity of phagocytic beads within macrophages showed a slight increase in LPS and a nonsignificant decrease with LPS + nomifensine. (D) Frequency histograms showing the skewed distribution of fluorescence intensity of phagocytic beads in macrophages across the 3 conditions. (E) Empiric cumulative frequency distribution curves of unstimulated, LPS-stimulated, and LPS + nomifensine–treated macrophages shows that LPS significantly increased phagocytosis compared with unstimulated condition (D-statistic = 0.1786, P < 0.0001). Cotreatment with LPS and nomifensine decreased macrophage phagocytosis back toward unstimulated levels (D-statistic = 0.1217, P < 0.0001, versus LPS-stimulated). Images and data in B–E are from n = 972–1510 cells/group across 3 independent experiments. Statistics were performed using Kolmogorov-Smirnov tests. (F) Representative images of cultured human macrophages treated as in A and incubated with MitoSox Red. (G) Only cotreatment with LPS + nomifensine produced a significant increase in mitochondrial superoxide levels compared with vehicle (P = 0.02). Images and data in (F and G) are from n = 12–13 experiments/group. Statistics were performed using a Kruskal-Wallis test with Dunn’s test for multiple comparisons.

