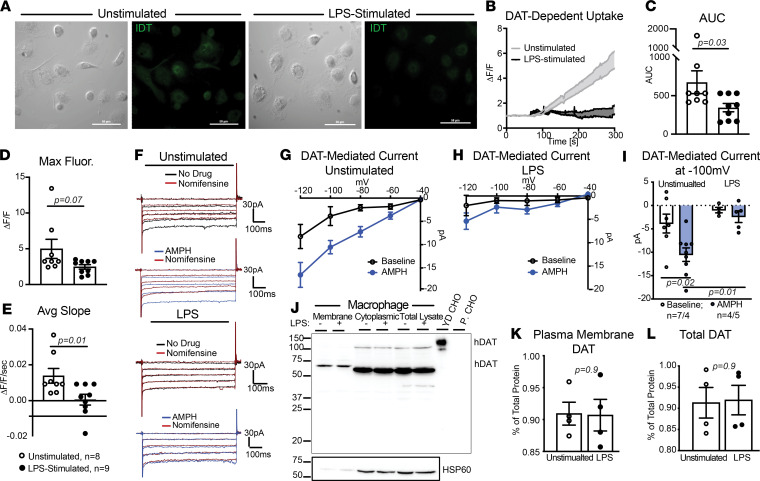
Figure 6. LPS stimulation decreases DAT-mediated uptake without affecting membrane or total DAT levels.
(A) Representative 40× images of unstimulated or LPS-stimulated macrophages assayed for DAT-mediated IDT307 uptake. (B) DAT-mediated uptake, measured as fold increase in fluorescence intensity, was calculated as described in Figure 3F. Compared with unstimulated macrophages (control group), LPS stimulation decreased the DAT-mediated IDT307 uptake. (C–E) LPS-stimulation decreased the magnitude (C, AUC, P = 0.03, Mann Whitney U test), max fluorescence (D, P = 0.07, Mann Whitney U test), and the rate (E, average slope, P = 0.01, Mann Whitney U test) of DAT-dependent IDT307 uptake. Data are from n = 9 independent experiments/group. (F) Representative whole-cell current traces from unstimulated or LPS-stimulated macrophages. (G and H) The current–voltage curves show the DAT-mediated inward currents at different hyperpolarizing voltage steps for unstimulated (G) and LPS-stimulated (H) macrophages. DAT-mediated inward currents were calculated by subtracting the inward current in the presence of nomifensine from the inward currents at baseline or in the presence amphetamine (AMPH). (I) In unstimulated macrophages, amphetamine induced a nomifensine-sensitive inward current (P = 0.02); however, LPS stimulation decreased the amphetamine-induced DAT-mediated current (P = 0.01). Data in F–I are from 4–7 experiments/group, and statistical analysis was performed via 2-way ANOVA with Tukey’s post hoc test for multiple comparisons. (J) Representative immunoblot of membrane and cytoplasmic DAT in macrophages measured by surface biotinylation in the presence or absence of LPS. YFP-DAT-expressing CHO cells and parental CHO cells were used as positive and negative controls, respectively. Cytosolic and membrane fractions confirmed by HSP60 (lower panel). (K and L) Surface DAT (K) and total DAT levels (L) are expressed as percentage HSP60 ± SEM, n = 4 independent biological replicates. LPS did not alter membrane DAT levels (P = 0.9, unpaired 2-tailed t test).

