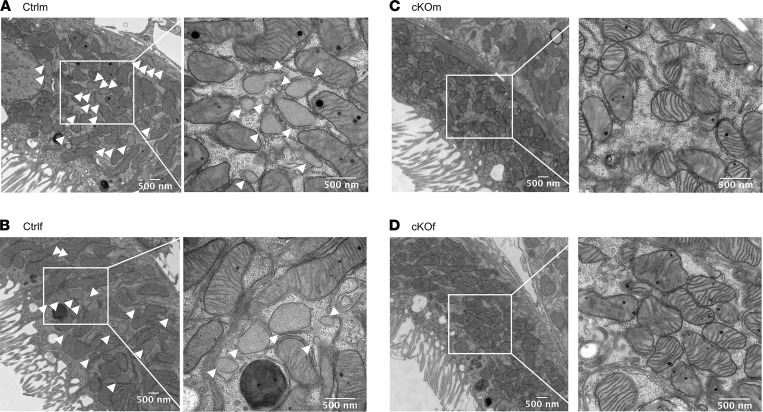
Figure 2. Validation of the cKO model by electron microscopy.
(A–D) Electron microscopy images of kidney proximal tubules in kidney cortex of Ctrlm (A), Ctrlf (B), cKOm (C), and cKOf (D) mice. The images are representative of 4 mice/genotype with 15 images analyzed/mice. White arrowheads indicate peroxisomes.

