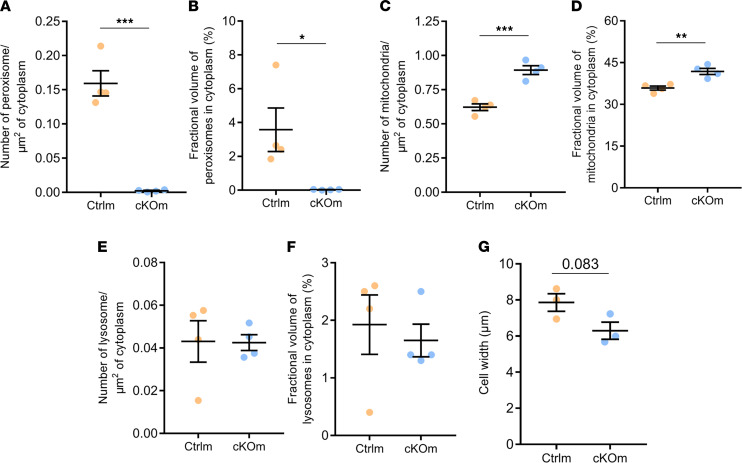
Figure 3. Stereological analysis of proximal tubule cells in kidneys of Ctrlm and cKOm mice.
(A) Number of peroxisomes/μm2 of cytoplasm; (B) fractional volume of peroxisomes in percentage of cytoplasm occupied by peroxisomes; (C) number of mitochondria/μm2 of cytoplasm; (D) fractional volume of mitochondria in percentage of cytoplasm occupied by mitochondria; (E) number of lysosomes/μm2 of cytoplasm; (F) fractional volume of lysosomes in percentage of cytoplasm occupied by lysosomes; (G) cell width. P = 0.083 (G). Stereology analysis was performed on n = 3–4 mice with 3 kidney cortex pieces per mouse, 15 micrographs per sample. Box and whiskers represent mean ± SEM; unpaired t test, ***P < 0.0001, **P < 0.001, *P < 0.05.

