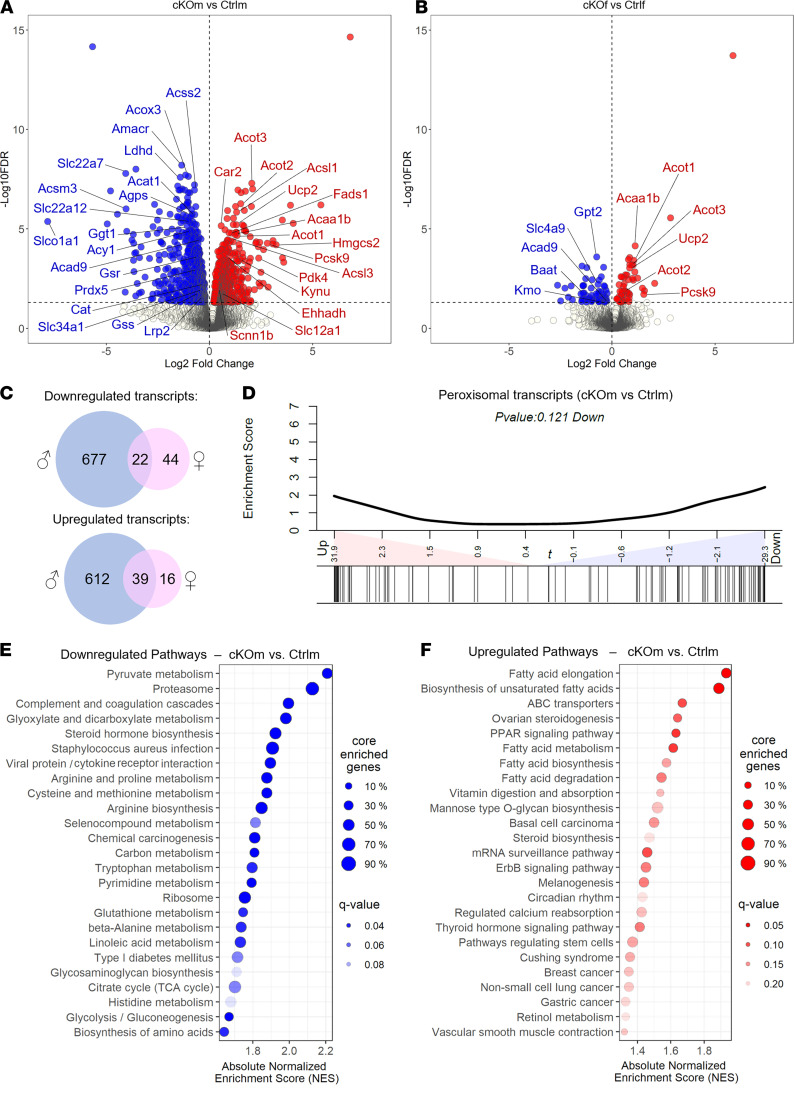
Figure 4. Transcriptional reprogramming in the kidneys of cKO mice.
(A and B) Volcano plot representing the relative transcriptional expression of all renal transcripts in cKOm versus Ctrlm (A) or cKOf versus Ctrlf (B). Transcripts depicted in blue are significantly downregulated while transcripts depicted in red are significantly upregulated. (C) Venn diagrams showing the number of transcripts significantly downregulated or upregulated in cKOm (in blue) or cKOf (in pink) mice versus Ctrl mice of the same sex. A significant transcript regulation is considered when the adjusted P value referred to as “FDR” is <0.05. (D) Enrichment analysis of a homemade gene set (based on the KEGG pathway mmu04146) targeting 100 transcripts related to peroxisomal functions, in cKOm versus Ctrlm mice. (E and F) Scatter plot of the top 25 most downregulated (E) or upregulated (F) metabolic pathways in cKOm versus Ctrlm mice, based on an untargeted GSEA using a database of 543 KEGG metabolic pathways. Pathways are sorted by their absolute normalized enrichment score. A significant pathway regulation can be considered when adjusted P value referred to as “q value” is <0.2.

