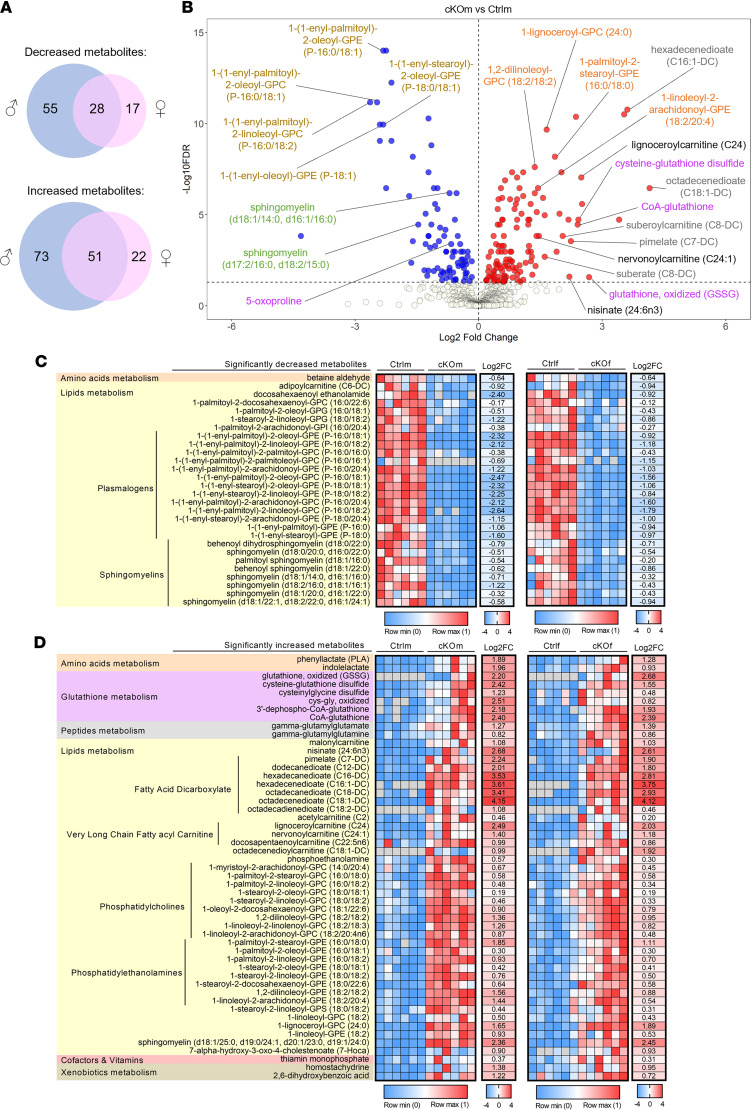
Figure 5. Remodeling of the renal metabolome in cKO mice.
(A) Venn diagrams representing the number of detected renal metabolites showing a significantly decreased or increased abundance in cKOm (in blue) or cKOf (in pink) mice versus Ctrl mice of the same sex. (B) Volcano plot representing the relative abundance of all detected metabolites in kidneys of cKOm versus Ctrlm. Metabolites depicted with blue dots are significantly less abundant, and transcripts depicted with red dots are significantly more abundant in kidneys of cKOm mice as compared with Ctrlm mice. The names of some representative metabolites are depicted using colors shared for related metabolites. (C and D) Heatmaps of metabolites showing a significantly decreased (C) or increased (D) abundance in cKO mice of both sexes as compared with Ctrl mice. A significant difference of abundance is considered when adjusted P value from a 2-way ANOVA referred to as “FDR” is <0.05. Metabolites are identified by their biochemical name and sorted by related metabolisms and subclasses of metabolites. For each metabolite, the individual expression of 6 Ctrl and 6 cKO mice normalized between 0 and 1 and the log2-transformed mean fold change of expression (Log2FC) in cKO versus Ctrl mice are given, for both sexes. For calculation of the mean FC of expression, missing values (depicted in gray) have been replaced by the minimum value of both genotypes from the same sex.

