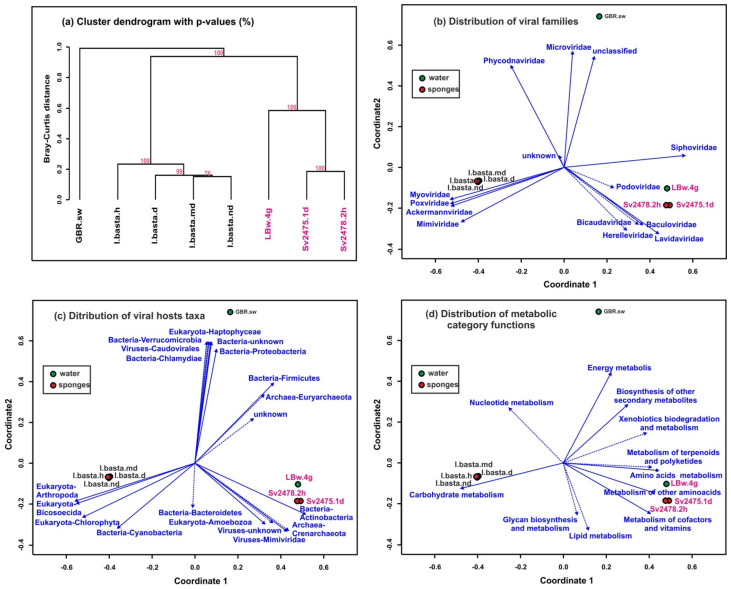
Figure 5.
Clustering of samples by similarity of the representation of scaffolds identified as viral. (a) Dendrogram constructed by the “average” method based on the Bray–Curtis distances (the dendrogram nodes contain the bootstrap support values). (b–d) Non-metric multidimensional scaling (NMDS) biplots of the virome datasets showing the following: (b) identification of viral taxa by homology with viral genomes and proteomes from NCBI RefSeq (vectors indicate the viral families); (c) viral hosts prediction, carried out using the Virus–Host database; (d) analysis of metabolic functional categories of viral proteins (AMGs). Unreliable vectors are marked with a dotted line. The Baikal samples are highlighted in pink.

