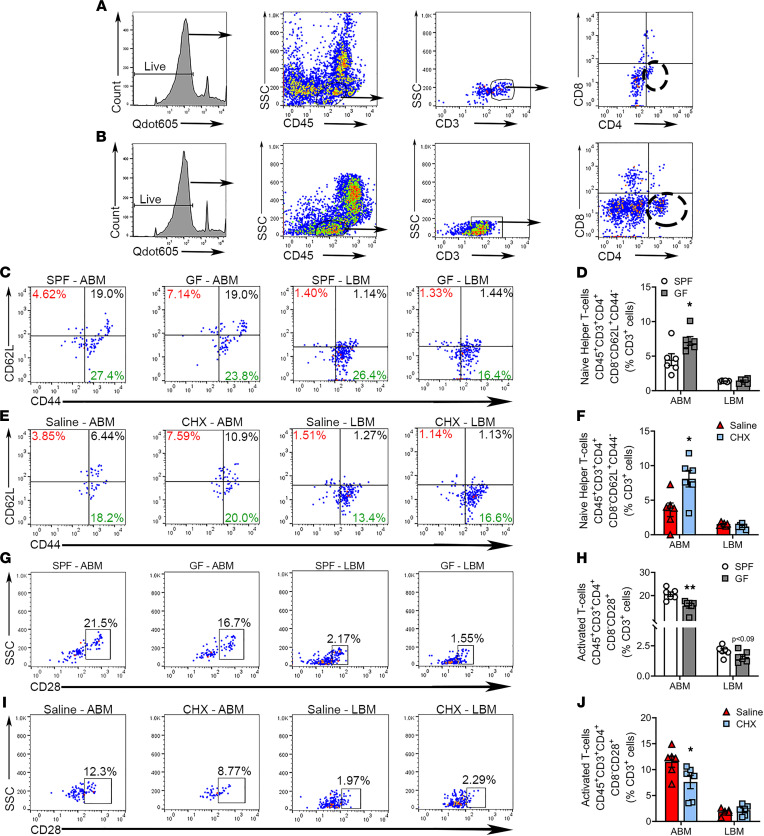
Figure 7. Commensal oral microbiota promotes Th cell activation in alveolar BM.
Flow cytometric analysis of CD4+ Th cells in the alveolar BM (ABM) and long BM (LBM), reported as percentage of CD3+ cells; n = 6/gp. (A and B) Representative gating strategy for CD4+ T cells in (A) ABM and (B) LBM. (C and D) Representative dot plots and quantitation (upper left; red %) for CD45+CD3+CD4+CD8–CD62L+CD44– naive CD4+ T cells in ABM and LBM of SPF versus GF mice. (E and F) Representative dot plots and quantitation (upper left; red %) for CD45+CD3+CD4+CD8–CD62L+CD44– naive CD4+ T cells in ABM and LBM of saline versus CHX mice. (G and H) Representative dot plots and quantitation for CD45+CD3+CD4+CD8–CD28+ activated CD4+ T cells in ABM and LBM of SPF versus GF mice. (I and J) Representative dot plots and quantitation for CD45+CD3+CD4+CD8–CD28+ activated CD4+ T cells in ABM and LBM of saline versus CHX mice. Unpaired t test; data presented as mean ± SEM; *P < 0.05, **P < 0.01.

