Figure 1.
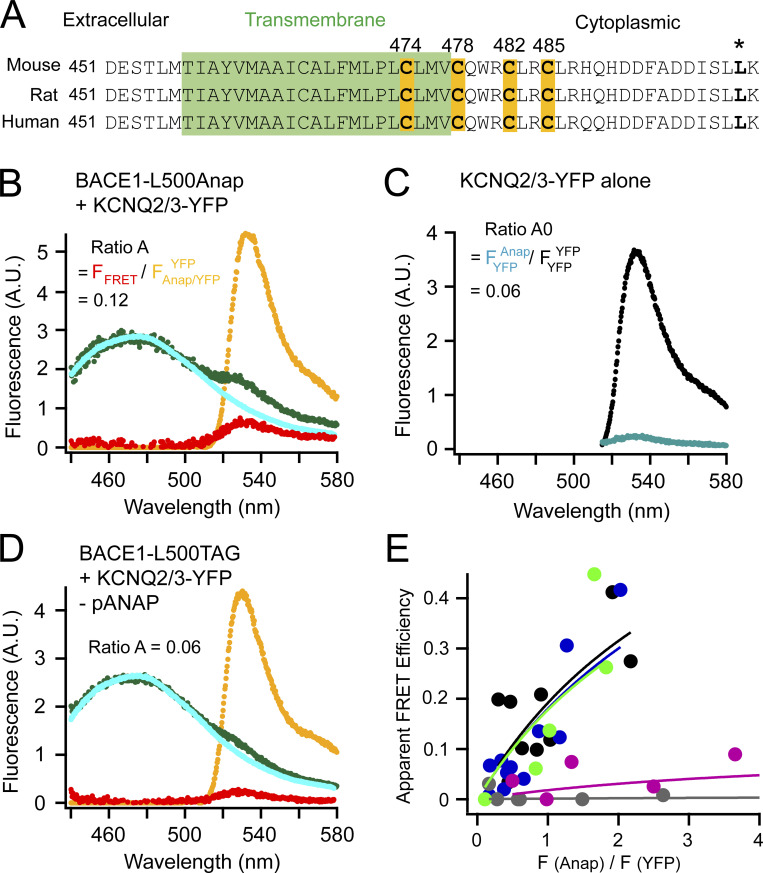
FRET between L-Anap incorporated in BACE1 and YFP-tagged KCNQ2/3 channels. (A) Sequence alignment of mouse, rat, and human BACE1 proteins highlighting the four cysteines for palmitoylation and the site of leucine 500 (*). The transmembrane region is in green. (B) Representative emission spectra used to calculate FRET between BACE1-L500Anap and KCNQ2/3-YFP. The cyan (donor only) and green spectra (both donor and acceptor) are generated by the Anap excitation wavelength; the yellow spectrum (with both donor and acceptor) by YFP excitation; the red spectrum is the subtraction of the cyan spectrum from the green spectrum. The ratio of the peak intensity of the red spectrum versus that of the yellow spectrum (ratio A = FFRET/FAnap/YFPYFP) after subtracting the crosstalk (ratio A0 = FYFPAnap/FYFPYFP shown in C) is proportional to the amount of FRET detected. (C) Representative emission spectra of KCNQ2/3-YFP-only cells using direct YFP excitation (large spectrum, FYFPYFP) and using excitation for Anap (small spectrum, FYFPAnap) for calculating ratio A0. (D) Representative emission spectra showing the negative control condition when the BACE1-L500TAG and KCNQ2/3-YFP were transfected but in the absence of the pANAP plasmid. (E) Relationship between the apparent FRET efficiency and the ratio of the peak intensity (at ∼475 nm) of the green spectrum divided by that of the yellow spectrum (at 530 nm) as in B or D in the following conditions shown in different colors: no pANAP (gray); the following conditions all with pANAP: wild-type BACE1 (black), mutant BACE1-4C/A (blue), with added 2-BP (green), and with KCNH instead of KCNQ2/3 (magenta). Each point represents data from one cell.

