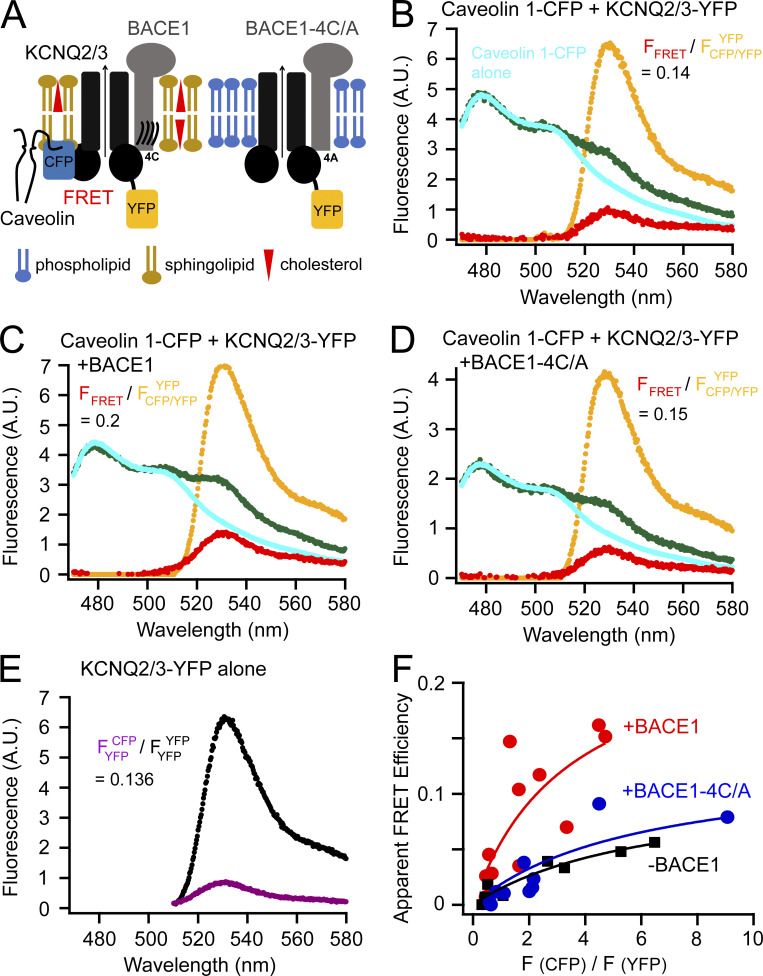
Figure 2.
FRET between caveolin 1–CFP and KCNQ2/3-YFP channels. (A) Cartoon illustrating the probing of the localization of KCNQ2/3 channels using the lipid raft–specific protein caveolin 1. (B–D) Representative emission spectra for calculating FRET between caveolin 1–CFP and KCNQ2/3-YFP. The cyan and green spectra are generated by illumination of the CFP excitation wavelength; the yellow spectrum by YFP excitation; the red spectrum is the subtraction of the cyan spectrum from the green spectrum. The equations with the numbers shown indicate ratio A. (E) Representative emission spectrum of KCNQ2/3-YFP alone cells using direct YFP excitation versus the spectrum (smaller amplitude) from the same sample by the excitation for CFP. The number following the equation is ratio A0. (F) Relationship between the apparent FRET efficiency and the ratio of peak intensities of CFP versus YFP for FRET between KCNQ2/3 and caveolin 1 in the conditions with or without BACE1 or with BACE1-4C/A.

