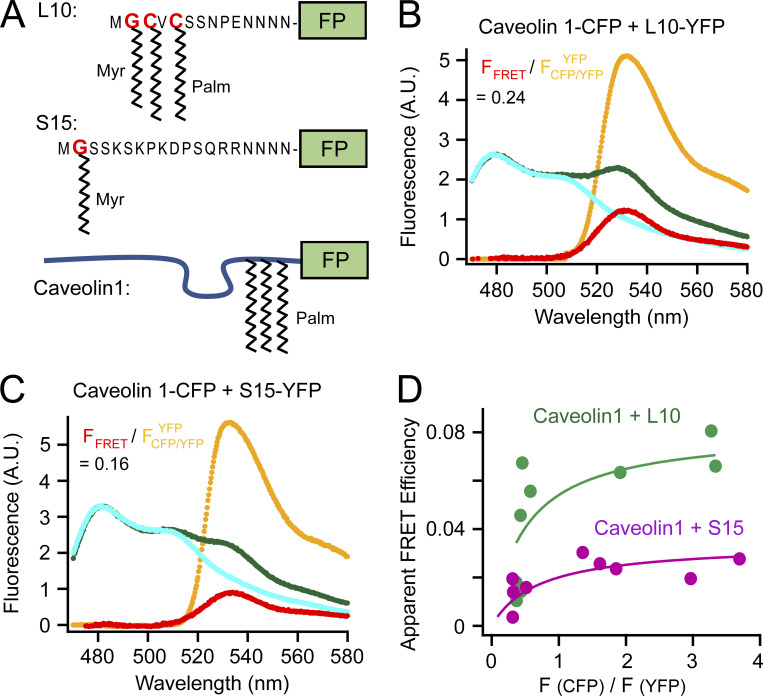
Figure 3.
Fluorescent probes that target to lipid rafts and non-rafts. (A) Schematic illustration of L10, S15, and caveolin 1. Sites of myristoylation and palmitoylation are shown. The Poly-N sequence is the flexible linker connecting to a fluorescent protein (FP), CFP or YFP in this article. (B) Representative emission spectra for FRET between caveolin 1–CFP and L10-YFP. (C) Representative emission spectra for FRET between caveolin 1–CFP and S15-YFP. (D) Relationship between the apparent FRET efficiency and the ratio of peak intensity of CFP versus YFP for the FRET pairs shown in B and C.

