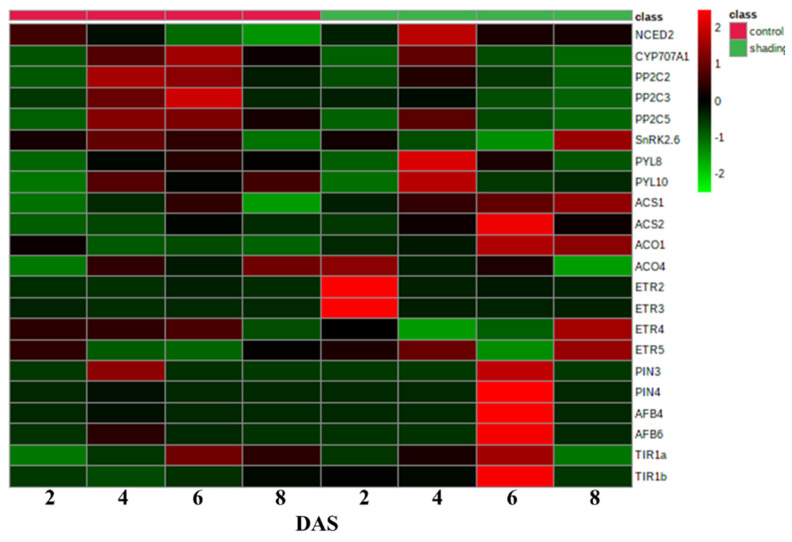
Figure 8.
Heat map for the expression of phytohormone signaling genes in tomato flowers under normal and shading conditions. It was generated based on the fold change of gene expression levels in control and shaded flowers at the 2nd, 4th, 6th, 8th, and 10th day after treatment when compared with the sample at 0 days after treatment. The values are means of three biological replicates with three technical replicates.

